

FULL RESEARCH ARTICLE
David J. Germano1*, Lawrence R. Saslaw2, and Eric Gerber3
1 California State University, Bakersfield, Department of Biology, Bakersfield, CA 93311, USA (retired) ![]() https://orcid.org/0000-0003-2146-0332
https://orcid.org/0000-0003-2146-0332
2 Endangered Species Recovery Program, California State University, Stanislaus, One University Circle, Turlock, CA 95382, USA
3 Northeastern University, Khoury College of Computer Science, Boston, MA 02115, USA
*Corresponding Author: dgermano@csub.edu
Published 23 March 2025 • doi.org/10.51492/cfwj.111.4
Abstract
In the San Joaquin Desert of California, USA, non-native herbaceous vegetation (mostly grasses) has altered the habitat to the detriment of many ground-dwelling species, some of which are protected rodent species. In a natural area, we installed 40 data loggers in simulated burrows that recorded temperature and humidity four times a day for 3.5 years, to determine if the burrow environment was affected by livestock grazing (20 loggers in a grazed plot and 20 in a control plot). We also installed four above-ground loggers (two in grazed and two in control). Although hot (35–40°C) in the summer, burrow temperatures were cooler in the summer and warmer in the winter than above-ground temperatures and had significantly lower daily variability. Humidity values were much higher in burrows throughout the year and significantly less variable daily than above-ground conditions. We found that burrows in the grazed plot were cooler and more humid than burrows in the grass covered control plot, except in winter when conditions were the same. We think that the dense cover of non-native grass in the control plot increased soil moisture loss by acting as a wick that pulled more moisture from the soil when grasses were growing during the spring than in the treatment plot. In areas with high cover of non-native grasses, cattle grazing may benefit burrowing rodents and other vertebrate burrow users by keeping burrows cooler and more humid than if grass cover is not removed.
Key words: Ammospermophilus, antelope squirrels, California, desert, Dipodomys, humidity, kangaroo rats, livestock, San Joaquin Valley, temperature
| Citation: Germano, D. J., L. R. Saslaw, and E. Gerber. 2025. Cattle grazing and long-term microclimatic fluctuations of simulated rodent burrows. California Fish and Wildlife Journal 111:e4. |
| Editor: Ange Darnell Baker, Habitat Conservation Planning Branch |
| Submitted: 5 November 2024; Accepted: 17 December 2024 |
| Copyright: ©2025, Germano et al. This is an open access article and is considered public domain. Users have the right to read, download, copy, distribute, print, search, or link to the full texts of articles in this journal, crawl them for indexing, pass them as data to software, or use them for any other lawful purpose, provided the authors and the California Department of Fish and Wildlife are acknowledged. |
| Competing Interests: The authors have not declared any competing interests. |
Introduction
Many rodents and other small mammals construct burrows in the ground that serve to protect individuals from predators and for some, to store food away from competitors (Hawbecker 1953; Kinlaw 1999; Burda et al. 2007; White and Geluso 2012). Also important is the environmental buffering that burrows provide to ameliorate extremes in above-ground temperatures and, especially in arid habitats, low humidity (Kinlaw 1999; Burda et al. 2007; Baldo et al. 2015; Milling et al. 2018). A potential disadvantage to living in a burrow for much of the time, especially for mammals, is the possible imbalance of CO2 and O2 compared to the atmosphere above ground because of the still air of the burrow and limited diffusion of gases through the soil (Studier and Baca 1968; Wilson and Kilgore 1978; Burda et al. 2007). Significant imbalances of gases in burrows may not occur, however, because of high diffusion of gases in porous soils, ventilation of the burrow by animal movement in and out, passive convection caused by temperature and humidity gradients between the burrow and the environment, forced convection by wind, and turbulent eddies of the above-ground atmosphere (Brickner-Braun et al. 2014 and references within). Also, burrowing mammals increase evaporative water loss to maintain normal body temperature at ambient temperatures above the thermal neutral zone (Baldo et al. 2015). Heteromyids in North America invariably live in burrows much of a 24-h period and constrain above-ground activity to nighttime (Kenagy 1973; Tracy and Walsberg 2002; Langsford 1983; Braun 1985). Protection from summer heat and winter cold, and extended periods of very low humidity, seem to be important reasons for the burrowing habit of this group.
As far back as the 1940s, the environmental benefits of burrowing by rodents in desert habitats have been known. Vorhies (1945) found that during a one week period in June, the soil surface temperature at a site in southeastern Arizona, USA, with banner-tailed kangaroo rats (Dipodomys spectabilis) varied from about 18.3–68.3°C (about 65–155°F; estimated from his fig. 2), whereas temperatures in a shallow burrow (depth not given) varied from about 33.3–38.9 °C (about 92–102 °F) and in a deep burrow about 26.7–29.4 °C (about 80–85 °F). In the same area and also using D. spectabilis burrows, Schmidt-Nielsen and Schmidt-Nielsen (1950) found temperatures above ground in June varied from 22.3–34.5 °C with a relative humidity of 1.0–44.0% recorded 0800 to 2240. At about the same time, burrow temperatures of D. spectabilis varied from 26.0–35.0 °C during the day (0900–2230) and from 22.5–34.5 °C at night (1900–0700), with relative humidity during the day in burrows of 18–62% and 17–54% at night. They also recorded data from several burrows of Merriam’s kangaroo rats (D. merriami) and found daytime temperatures of 25.5–43.5 °C and humidity of 25–91%. Dipodomy merriami is smaller than D. spectabilis and makes shallower and less complicated burrows (Schmidt-Nielsen and Schmidt-Nielsen 1950). Later studies have found similar environmental conditions of simulated and natural rodent burrows (Studier and Baca 1968; Kay 1975; Kay and Whitford 1978; Tracy and Walsberg 2002). Generally, most studies have been of short duration of days, months, or a year and with small sample sizes (fewer than 10 recording devices).
Throughout the world, ecosystems have been invaded by non-native plants, especially grasses (D’Antonio and Vitousek 1992; Seabloom et al. 2013; Mahood et al. 2021). This change has led to negative effects to plants and animals and promotes wildfires, which further degrade the ecosystem (D’Antonio and Vitousek 1992; Vitousek et al. 1997; Levine et al. 2003; Fusco 2021). In the San Joaquin Desert of North America (Germano et al. 2011), the above ground environment rodents experience has changed markedly in the past 150 years. This desert was probably relatively open saltbush (Atriplex spp.) habitat with much open ground between bushes through most of the year (Germano et al. 2011). Variable rainfall produced a patchy to extensive array of annual forbs (with few annual grasses) during the spring (Germano et al. 2001; Minnich 2008). Now, however, much of the remaining natural lands are either dense grassland dominated by non-native species or shrubland with a dense non-native grass understory (Germano et al. 2011, 2012; Cypher 2024).
In years with average to above average rainfall in the San Joaquin Desert, resultant thick grass cover impedes above-ground movements of some rodents, especially kangaroo rats (Dipodomys sp.; Price 1978; Goldingay et al. 1997; Jones et al. 2003). Livestock grazing has been used to reduce the cover of grasses to benefit several small terrestrial vertebrates endemic to the San Joaquin Desert, including giant kangaroo rats (Dipodomys ingens), San Joaquin kangaroo rats (D. nitratoides), blunt-nosed leopard lizards (Gambelia sila), and San Joaquin antelope squirrels (Ammospermophilus nelsoni; Germano et al. 2001, 2012). Besides changing the environment that rodents face above ground, the removal of herbaceous cover might affect the microclimate of burrows that rodents inhabit, which are also used by lizards and snakes.
In 2003, we initiated a study to better understand the microclimatic factors (temperature and humidity) that rodents experience underground, and the effect cattle grazing could have on rodent burrow environments. Although some work on burrow microclimates has been done previously, we used much larger sample sizes over a much longer time than previous studies, and no studies have examined the effect that reducing grass cover by livestock grazing has on the microclimates of burrows. We used data loggers in 40 simulated burrows, 20 placed in a grazed plot and 20 in a control plot, that ran for 3.5 years in the San Joaquin Desert of California to gather data to assess this variability. Because cattle can remove much of the above ground biomass of herbaceous plants, we hypothesized that grazing by cattle would affect the microclimate of simulated burrows. We predicted that burrows in the plot grazed by cattle would be hotter and drier than burrows in the control plot shaded by grass cover.
Methods
Study Site
Our study site was located within the Lokern Area of Critical Environmental Concern of western Kern County, California, USA, west of the agricultural community of Buttonwillow (Fig. 1). The area falls within the boundaries of the San Joaquin Desert (Germano et al. 2011), which has an arid Mediterranean climate with hot, dry summers and cool, wet winters (Dallman 1998). At the town of Buttonwillow, 13.5 km east of the study area, average high air temperatures measured in the shade in August are 35.7 °C and lows are 17.3 °C, and average January daytime highs are 12.9 °C and night-time lows are 1.0 °C (http://www.worldclimate.com). Average yearly rainfall (July–June) at Buttonwillow was 169 mm (6.65 in; 20-y average; Buttonwillow Water Storage District, unpubl. data), with virtually no rain falling from early April through October.

The study site is a gently sloping (2–5%) alluvial plain with soils classified as Kimberlina sandy loam and Kimberlina gravelly sandy loams, which are derived mostly from granitic and sedimentary rock (Soil Conservation Service 1988). Permeability is moderately rapid, available water capacity is moderate, runoff is slow, and water erosion is moderate and restricted to several small arroyos. Effective rooting depth is 150 cm or more. In short, the soils are good for vegetation and burrowing animals, with the main limiting factor being sparse rainfall, as outlined above.
Our study area was dominated by native allscale saltbush (Atriplex polycarpa) and spiny saltbush (A. spinifera) intermixed with extensive areas of largely non-native grassland. Herbaceous cover was dominated by the non-natives red-stemmed filaree (Erodium cicutarium), Mediterranean grass (Schismus arabicus), red brome (Bromus madritensis ssp. rubens), and foxtail barley (Hordeum murinum) along with the native forb shining peppergrass (Lepidium nitidum). Other native forbs included fiddleneck (Amsinckia menziesii), pygmy stonecrop (Crassula connata), California mustard (Guillenia lasiophylla), alkali peppergrass (Lepidium dictyotum), tansy-leaved phacelia (Phacelia tanacetifolia), valley popcorn flower (Plagiobothrys canescens), and slender tropidocarpum (Tropidocarpum gracile).
Vertebrates known or suspected to occur in the Lokern Natural Area include 2 amphibians, 8 reptiles, 21 birds, and 17 mammals (pers. obs.). Five terrestrial vertebrates are special-status species or are listed as threatened or endangered: the blunt-nosed leopard lizard, giant kangaroo rat, short-nosed kangaroo rat (Dipodomys nitratoides nitratoides), San Joaquin antelope squirrel, and the San Joaquin kit fox (Vulpes macrotis mutica). These vertebrates are also endemic to the San Joaquin Desert (Germano et al. 2011). Other terrestrial vertebrates on the study site with no special conservation status are the western whiptail (Aspidoscelis tigris), side-blotched lizard (Uta stansburiana), San Joaquin pocket mouse (Perognathus inornatus inornatus), and Heermann’s kangaroo rat (Dipdomys heermanni). The area was used to study the effects of livestock grazing on a suite of species from 1997 to 2006 using 4 control (ungrazed) and 4 treatment (grazed) plots (Germano et al. 2012).
Field Methods
Starting in late November 2003, we installed 40 temperature and humidity loggers (Hobo Pro RH/Temp, model H08-032-08; Onset Computer Corporation, Bourne, Massachusetts, USA) on the study site, split evenly between one control (protected from cattle grazing) and one treatment plot. These plots were within 800 m of each other. Because of the high expense of these units, we could not place loggers on all four replicated sites in sufficient numbers to also assess within plot variation. Therefore, we only used the paired treatment and control plots on one section. This section (Section 27) had the highest consistent number of rodents before data logger placement (Germano et al. 2012), the greatest amount of topographical relief, and the two plots were very similar in terms of soil and vegetation.
In treatment plots, cattle grazed throughout the section and the aim was to leave them to graze until residual dry matter (RDM) was down to 560 kg/ha (500 lbs/ac) by the end of the growing season. Cattle grazed from February until July from 1998–2000, but because of below-average rainfall from 2001 to 2004, no cattle grazed the treatment plots and grass cover was minimal on both plots we used. Residual dry matter (RDM) on the control plot in 2002 was 895 kg/ha when measured in August and decreased to 278 kg/ha by 2004, and on the treatment plot was 440 kg/ha in 2001 and decreased to 112 kg/ha by 2004 (unpubl. data). Higher rainfall in 2005 and 2006 substantially increased herbaceous ground cover on each plot and cattle grazed the treatment plot April to August in 2005 and April to May in 2006 (Germano et al. 2012). Cattle grazing significantly reduced the amount of herbaceous cover on the treatment plot in 2005 and 2006 compared to the control (Fig. 2), with RDM on the treatment plot of 391 kg/ha in 2005 and 744 kg/ha in 2006 after grazing ended compared to 1,519 kg/ha in 2005 and 1,765 kg/ha in 2006 on the control plot (unpubl. data).

At the time of the study, we had Hobo temperature and humidity data loggers purchased in 2001 that were fairly large compared to later units. The loggers were too large to insert into natural burrows of kangaroo rats or squirrels. Also, small data loggers would likely have been buried in dirt by the occupant if we had used natural burrows (Vorhies 1945). The tunnel size and depth of the simulated burrows, however, approximated the size and depth of burrows used by giant kangaroo rats, a state and federally listed endangered species at our site. Shaw (1934) gave a tunnel diameter of 10.16 cm and a depth below the surface of 12.7–30.5 cm. Our simulated wire-mesh tunnels were 12.7 cm in diameter and dug down into the ground to about 30 cm below the surface. These simulated burrows also approximate burrows used by San Joaquin antelope squirrels, a state-listed threatened species at our site. This species rarely excavates its own burrows, and most often uses burrows of kangaroo rats, including giant kangaroo rats (Hawbecker 1953). We dug artificial slanting burrows that extended about 115 cm into the soil, and about 30–40 cm below the surface at the distal end (Fig. 3). Into each excavation we inserted a 122-cm long tube constructed of 6.4 mm (0.25 in)-mesh hardware cloth, which was blocked at each end to exclude rodents (Fig. 3).
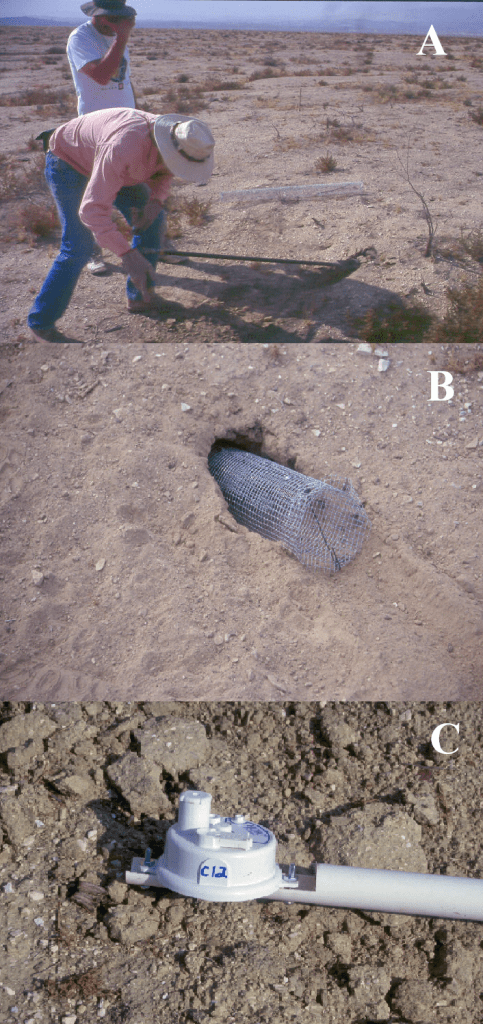
We used a combination of two methods to determine the location of each simulated burrow. During the grazing study, 300 × 300 m2 plots were established in the 4 control and the 4 grazed plots with wooden stakes placed every 20 m along 16 rows to allow censusing of lizards and as a trap grid for antelope squirrels (Germano et al. 2012). We used these grids to locate sites for the simulated burrows. The stakes formed 225- 20 × 20 m squares on each plot that we numbered 1–225. We randomly picked 20 squares within each grid and within each of these randomly chosen squares, we subjectively chose an active rodent burrow that was associated with other burrows and was located on slightly higher ground than the surrounding area to prevent rainfall runoff from channeling into the burrow. We then used a hand-operated soil auger to dig a straight simulated burrow exactly through the opening of the active burrow (Fig. 3). Once our new burrow was made, we inserted the wire-mesh tube so that about 10 cm was exposed at the mouth. In cases where soil around the mouth of the burrow collapsed, we covered the wire-mesh tube with a folded paper bag and covered this with about 5–10 cm of soil. We attached each data logger to the end of a 100-cm long 1.3-cm diameter PVC pipe (Fig. 3) and inserted this unit into each simulated burrow so that the humidity port on the logger faced upwards at the bottom of the burrow. In January 2005, we also placed two data loggers above ground at opposite ends of the lizard/antelope squirrel grids. Each data logger was attached to the underside of a 14 × 14 cm galvanized metal plate that we attached to a metal t-post, which was approximately 25 cm above the ground. These units recorded temperature and humidity at the same times as the below-ground loggers.
We programmed the loggers on the study site to read quarterly per 24-h period (0000, 0600, 1200, 1800) starting at 1800 on 4 November 2003. We downloaded data and replaced batteries from all 40 data loggers several times through the course of the study. We also needed to clear out dirt occasionally that filtered into some tunnels over the study period. Additionally, entrances for some simulated burrows were crushed by cattle on the treatment plot in 2005, and this caused data loggers to malfunction, which resulted in lost data from those loggers until we replaced these crushed tubes.
Data Analysis
We used R version 4.1.2 (R Core Team 2021, https://www.r-project.org/), and the mgcv (Wood 2011) and gam (Hastie 2020) packages for their Generalized Additive Model (GAM) with integrated smoothness estimation functions that allow for replacing missing observations. The first level GAM in this study can be defined as:
E(yi )=αi+βi+γi+f1 (x1i)+f2 (x2i) [1]
where each observation has response variable , a vector with two values: temperature (°C) and relative humidity (percentage), and it is assumed follows a bivariate normal distribution. Predictors included plot (αi: control and treatment), position of data logger (βi: above ground and below ground), season (γi: Winter, Spring, Summer, Fall), and two continuous variables: year (x1i) and time of day (x2i: 0000, 0600, 1200, 1800) each fit with smooth functions, (f1 and f2, respectively; Hastie 1992). We defined seasons as: (1) Winter = 1 December to 15 March; (2) Spring = 16 March to 15 June; (3) Summer = 16 June to 30 September; and (4) Fall = 1 October to 30 November, which were based on average temperatures (lowest for winter period, intermediate for spring and fall, and highest for summer). We think this is a better estimate of seasons in our area than calendar/sun position dates. Year was also included in the model as a continuous predictor fit with a smoothing function.
The GAM model matrix is defined by setting baseline categories of the categorical predictors (plot, position, and season) and the corresponding parameters for each are estimated in relation to the baseline categories. For the fitted model, the baseline categories were Control plot, Above position, and Fall season. Baseline categories are used as a reference setting; effects were estimated for other categories against or in relation to these baseline categories. For the R packages we used, baseline categories were chosen alphabetically by default, which we kept. The results of the GAM are invariant to the choice of baseline in studies with balanced designs, as comparing A to B is equivalent to comparing B to A except for the sign (positive vs. negative). Because for both temperature and humidity at least one four-way interaction between plot, position, season, and time of day was significant, the final model included all fourth level and lower interactions between those factors. The gam package also makes use of the na.gam.replace method, which replaces missing values imputed at the mean of the non-missing entries (Hastie 1992). This was the most attractive aspect of the GAM architecture, as there was occasional data loss as described in Field Methods.
Jointly modeling temperature and relative humidity also accounts for the significant negative correlation between the two response variables (r = –0.46, P < 0.001). Including season as a predictor, instead of constructing separate models, accounted for interactions between season and the other design variables. We created graphs of predicted temperature and humidity to visually assess impacts of the predictors. Using predicted response values rather than raw data values allows us to understand the trends in the data recovered from the model. To test specifically for any differences in temperature and humidity between treatment and control plots, we created a new GAM that excluded Plot and compared the residual deviance between the two models (with vs. without Plot). We then used Two Sample t-tests on the predicted values of temperature and relative humidity between control and treatment plots.
Results
Microclimate of Simulated Burrows
The full model fit explained 66% of the deviance in the jointly modeled distribution of temperature and relative humidity data. The likelihood ratio test found a significant difference in the deviance of the model with plot vs. without plot (D = 11,718, P< .001) suggesting the importance of the treatment effect in both response variables. For the predictor effects on temperature in the full model, there were significant interactions of plot and position of data loggers (Appendix A), indicating that moving from Control and Above (baseline), to Treatment and Below, produced a significant decrease in temperature during Fall seasons and across time of day. This is different from the significant increase in temperature when moving from Above to Below position in Control plots during the Fall (Appendix A). Most combinations produced significant differences from the baseline categories (Appendix A). All positions and seasons within Control plots were different from baseline. This included a significant increase in temperature when moving from baseline to Control, Below, Summer (Appendix A).
There was a significant three-way interaction of plot, position of data loggers, and season on temperature (Fig. 4). There was much more variability in above-ground temperatures than in burrows (below ground), with differences largely attributable to the time of day, as above-ground air temperature increased over the course of the day, while temperature in burrows remained relatively stable (Figs. 4 and 5). Burrows in treatment plots also showed significantly lower temperatures across seasons below ground, while there was no difference above ground (Fig. 4). The coefficient for year was significant (P< 0.05) and shows that there is reason to believe this pattern of temperature differences within a year to be true in both above and below ground positions of data loggers across years (Fig. 6). Predicted temperature differed significantly between treatment and control plots (t = 46.43, P < 0.001), and the 95% confidence interval for Control-Treatment was 1.683–1.831. Predicted temperatures in burrows in the control plot were significantly warmer than the burrows in the treatment plot by nearly 2°C.


temperature (Top set) and relative humidity (Bottom set) of data loggers recorded at 0000, 0600, 1200, and 1800 in simulated burrow (T&C) and above ground (Above) from 2003 to 2007 in the San Joaquin Desert of California, USA. Black dots are outlying observations. This representation of seasonal changes was made using a random day for all data loggers (7 January, 14 April, 27 July, and 24 October) across seasons.
There were slightly fewer significant differences from baseline in terms of humidity. Season was significant, with the largest change being the relative humidity decreasing in the summer in burrows in control plots, above ground, relative to the fall (Appendix B). While relative humidity was generally higher in burrows than above ground, this is not true when moving from the baseline to above ground (Appendix B). Burrows in the winter had pronouncedly higher relative humidity than other seasons across the other predictors; the only significant negative difference of winter to baseline is Control, Below, Winter (Appendix B).https://nrm.dfg.ca.gov/FileHandler.ashx?DocumentID=229678
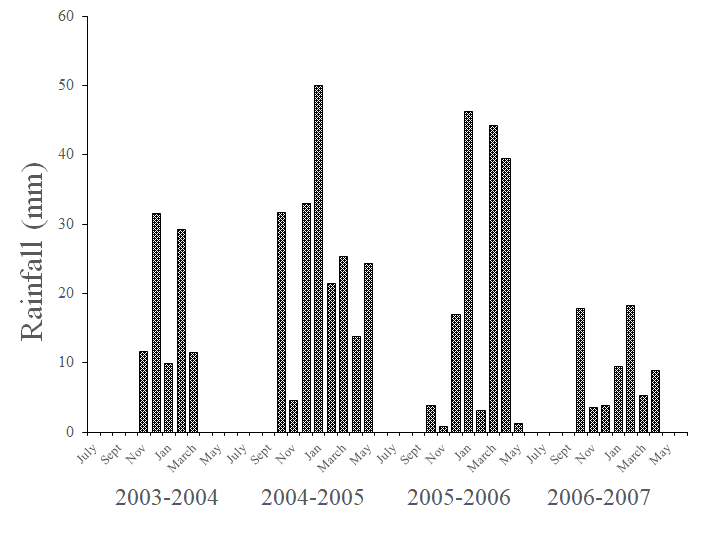
As with temperature, there was a significant three-way interaction of plot, position of data loggers, and season on relative humidity (Fig. 4). As expected because of the inverse relationship between relative humidity and temperature, whether above or below ground, humidity in burrows was lowest in the summer and highest in the winter, and moderate in spring and fall, although humidity in burrows were slightly greater in the spring than in the fall (Fig. 4). Humidity in burrows in the treatment plot was also significantly higher than in the control plot, while slightly lower above ground (Fig. 4). In general, as with temperature, there was much more variability in above-ground humidity than in burrows (below ground), again in large part due to the time of day, as humidity decreased during daylight hours above ground, while slightly increasing in burrows (Figs. 4 and 7). Additionally, the coefficient for year included in the model was again significant for relative humidity (P < 0.05; Fig. 6), which matches the differences in yearly rainfall (Fig. 8). Rainfall varied across the 3.5 year of the study with total rainfall lowest in 2003–2004 (93.7 mm) and 2006–2007 (67.1 mm) and highest in 2004–2005 (204.0 mm) and 2005–2006 (155.8 mm). Average temperature and humidity varied much more across a day above ground than for below-ground data loggers (Fig. 6). The higher rainfall in 2004–2005 and 2005–2006 was reflected by higher humidity levels in burrows in winter and spring of 2005 and 2006, averaging 89–98% humidity, whereas averages were 76–88% in 2004 and 62–76% in 2007 (Fig. 7). Relative humidity predictions differed significantly between treatment and control plots (t = 68.60, P < 0.001), and the 95% confidence interval for Control-Treatment was –4.175, –3.942. Average relative humidity in burrows in the control plot were significantly less humid than the burrows in the treatment plot by about 4%.

Of the 40 data loggers we placed below ground (irrespective of plot type), the maximum temperature in six burrows were < 35°C (n = 1,066–2,674 data points per logger), in 22 burrows were 35–40°C (n = 2,108–4,948), and in 12 were 40.1–45.4°C (n = 3,755–5,171). Minimum temperatures in two burrows were > 10°C (n = 2,679–4,580), 29 were 5–10°C (n = 2,108–5,170), and in eight were -1.6–4.9°C (n = 2,161–5,171). For the four data loggers above ground, maximum temperatures were 51.79°C (n = 1,760) and 49.56°C (n = 3,394) for the two loggers on the control plot and 50.11°C (n = 3,397) and 49.02°C (n = 3,398) for the two loggers on the treatment plot. Minimum temperatures were –2.44°C (n = 1,760) and –9.46°C (n = 3,394) on the control plot and –9.46°C (n = 3,397 and 3,398) for both loggers on the treatment plot.
Cattle Effect on Simulated Burrows
Because of increased rainfall in 2004–2005 rain year (Fig. 8), herbaceous cover increased sufficiently for cattle to be turned out on treatment plots in early 2005 (Germano et al. 2012). When we made a check of burrows on 27 April 2005, we found that the front (about 0.5 m) of the wire tubes and the dirt above 14 of the 20 simulated burrows was collapsed by cattle (microclimate data lost). We dug new tunnels at the same burrows and installed data loggers into new wire mesh tubes to replace those crushed. We also installed a 1 × 1 m piece of heavy wire mesh (15 × 15 cm mesh spacing) on the ground above all 20 burrows in the treatment plot to keep cattle from crushing burrows.
Above-ground temperatures did not differ between control and treatment data loggers, but temperatures were higher across seasons in data loggers below ground for the control than the treatment plot (Fig. 4). In general, while burrows in the control plot seemed to have higher temperatures on average than burrows in the treatment plot across seasons with the clearest differences in spring and summer, differences were clearly dependent on time of day (Fig. 5). Humidity also did not differ greatly between control and treatment data loggers that were above ground, but humidities were higher across seasons in treatment data loggers below ground than for control loggers below ground (Fig. 4). Burrows in the treatment plot had higher humidities than in the control plot consistently throughout the day in all seasons except perhaps Winter (Fig. 7). We also saw via statistical tests that plot (control vs. treatment) is an important predictor of both temperature and relative humidity, and that there were significant differences between both predicted temperature and relative humidity in control and treatment plots using the GAM model results.
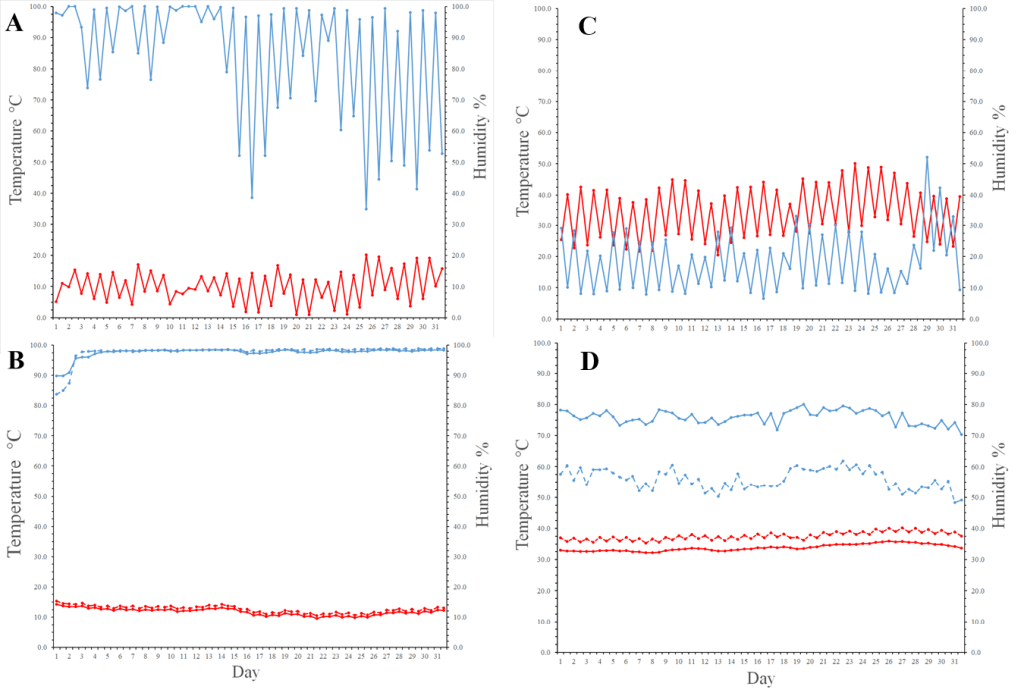
These differences between burrows in the control and treatment plots can be seen more easily by observing daily changes in temperature and humidity for above ground, control, and treatment data loggers during January 2006 and July 2006 after cattle significantly decreased herbaceous biomass in the treatment plot. Although temperature and humidity were similar between control and treatment loggers in January (Fig. 9), temperatures were consistently higher and humidity consistently lower in the burrows in the control than in the treatment plot in July (Fig. 9). Also, across the 3.5 years of data collection, the average maximum burrow temperature in the treatment plot was 35.92°C ± 0.62°C (SE), with only one burrow > 40°C, and the average in the control plot was 40.47°C ± (0.56 °C), and 11 loggers registered maximums > 40°C. The average maximum burrow temperatures differed significantly between plots (F1,38 = 29.54, P < 0.001). The average minimum burrow temperature in the treatment plot was 7.35°C ± (0.62°C), and the average in the control plot was 6.96°C ± (0.55°C), but the difference was not significant (F1,38 = 0.224, P = 0.638). For humidity, the average maximum in burrows in the treatment plot was 99.1% ± 0.53% (standard error) and the average in the control plot was 99.8% ± (0.25%), and the difference between means was not significant (F1,34 = 1.296, P = 0.263). In contrast, the average minimum humidity in burrows in the treatment plot was 41.3% ± (4.31%) and the average in the control plot was 23.0% ± (2.48%), and these averages were significantly different (F1,34 = 14.30, P < 0.001).
Discussion
We recognize that our simulated burrows are only a first approximation of what temperature and relative humidity conditions are like for larger rodents in the San Joaquin Desert and how grazing by livestock may affect these conditions. Based on the commercial technology readily available at the time of our study, our data loggers were large; too large for most of the natural kangaroo rat burrows. Our simulated burrows, therefore, did not have the twisting tunnel architecture of many kangaroo rat burrows (Vorhies 1945; Shaw 1934; Williams and Kilburn 1991; Germano and Rhodehamel 1995), although some kangaroo rats make fairly simple burrows (Schmidt-Nielsen and Schmit-Nielsen 1952; Germano and Rhodehamel 1995). Also, sometimes kangaroo rats plug their burrows during the day (Shaw 1934; Williams and Kilburn 1991; Edelman 2011), which we could not replicate. Even with much smaller data loggers, however, it may not be possible to use natural burrow systems because burrowing rodents tend to bury any foreign objects in their tunnels (Vorhies 1945). Perhaps a very slender probe could be pushed deep into a natural burrow system connected to an above-ground logger that would go undetected by the rodent occupant.
Even given these limitations, there still is important information derived from our simulated burrows. As we hypothesized, cattle grazing had a significant effect on the microclimate of simulated rodent burrows; however, temperature and humidity effects were opposite of what we predicted. Highest maximum temperatures in our burrows occurred almost exclusively in the control plot. Also, humidity was generally lower in burrows in the control plot, especially during the summer. Once cattle grazing occurred on the treatment plot with the return of higher rainfall in the 2004–2005 rain year, there was greater cover and biomass of herbaceous plants (mostly grasses) in the control plot from 2005 to the end of the study. Herbaceous biomass (measured in August) was 1,519.0 kg/ha in 2005 and 1,764.9 kg/ha in 2006 on the control plot but was 390.7 kg/ha in 2005 and 744.4 kg/ha in 2006 on the treatment plot (Germano et al. 2012). We predicted that this herbaceous cover in the control site would shade the ground and lead to cooler and more humid burrows. This seems not to have been the case. The grass cover, rather than keeping the ground cooler, thereby reducing soil moisture loss (and therefore keeping higher burrow humidity), may have acted as a wick that pulled more moisture from the soil when grasses were growing during the spring than in the treatment plot. A decrease in soil moisture down to 30 cm caused by the invasive cheatgrass (Bromus tectorum) has been found at a site in Colorado, even with an average annual rainfall of 390 mm (Garbowski et al. 2021). We speculate that non-native grasses, particularly red brome and foxtail barley, which dominated our site, may have acted as does cheatgrass and removed soil moisture in the spring when these grasses were growing. We do not have a good explanation why burrow temperatures in the summer and fall were also higher in the ungrazed plot than in the grazed plot. If soil moisture is greatly reduced by roots of ungrazed grasses on the control plot compared to the grazed plot and the water taken up by the plants is evaporated from the above ground portions of the plants, the evaporative cooling would occur above the soil surface rather than at the soil surface. If so, then perhaps the soil would be warmer during the hot months in the ungrazed plot.
This high herbaceous cover may present a particular problem for burrowing rodents that did not evolve in these conditions. The San Joaquin Desert was mostly an open habitat with moderate to widely scattered shrubs and few grasses (Minnich 2008; Germano et al. 2011) before the invasion of non-native grasses and forbs that form dense ground cover in years with average to high amounts of rainfall. This dense cover of grasses and forbs has been correlated with lower abundances of blunt-nosed leopard lizards, kangaroo rats, and San Joaquin antelope squirrels, likely due to decreasing the ability of these species to avoid predators (Single et al. 1996; Cypher 2001; Germano et al. 2001; Germano and Saslaw 2017). Although cattle can have a detrimental effect on burrowing rodents by crushing some burrow entrances, in the grazing study on the Lokern, population abundances of many animals were higher where cattle grazed than in control plots, including giant kangaroo rats, San Joaquin antelope squirrels, and short-nosed kangaroo rats (D. nitratoides brevinasus), and no species had lower abundances on grazed plots (Germano et al. 2012). Also, cattle have been out on rangeland in the San Joaquin Desert where giant kangaroo rats occur for decades and only rarely are burrows damaged. We suspect that cattle were drawn to the tubes that we installed and that we inadvertently caused the damage to these simulated burrows. Our data indicate that livestock grazing also seems to moderate burrow microclimate conditions when dense herbaceous cover is removed, which also could be a benefit to many species that use small burrows.
Our data also extend the understanding of burrow microclimates apart from the effect of cattle grazing. There have been several studies of rodent burrow environments using simulated burrows (Studier and Baca 1968; Soholt 1974; Kay and Whitford 1978) but, with the exception of the study by Kenagy (1973), who dug vertical shafts into which he placed little pocket mice (Perognathus longimembris), our study is the first to use simulated burrows in the field, and of all studies (natural or laboratory), our sample size was much greater than any other study and the duration of the study (four daily readings for 3.5 years) was also much longer. In line with past studies, our data on temperature and humidity show that simulated rodent burrows maintain significantly more equitable conditions throughout the year than what an animal would experience above ground.
Because of lack of funds, we only installed two above-ground data loggers at each site, which may not have captured all of the variability in temperatures and humidity on the surface of the sites. Despite this, we found wide swings in temperature and humidity above ground daily and seasonally that were ameliorated in burrows, which we think would not have changed with additional above-ground loggers. Although above-ground temperatures reached as high as 51.8°C in the summer at our study site, burrow temperatures generally stayed between 35–40 °C, although some reached 45.4°C. In the summer, humidity above ground could drop below 10%, whereas humidity in our simulated burrows remained at 40–85%. In winter, burrow temperatures were cold (generally 5–10°C but could drop to as low as –1.6°C) whereas above-ground temperatures could be 7 to 15°C lower than burrows, sometimes dipping to almost –10°C. Humidity in burrows at the coldest times of the year generally stayed between 75–100% throughout the day (about 50–75% in January 2007) but could drop below 30% late in the day (1800) above ground. We also found that humidity in burrows can change across years in response to variation in yearly rainfall (as in 2007), typical of desert habitats.
Heat tolerance of desert rodents is correlated with the environmental conditions that different species experience, such that species that exist in hotter microsites physiologically tolerate higher burrow temperatures than those in cooler microsites (van Jaarsveld et al. 2021). Walsberg (2000) was the first to show that burrow temperatures of kangaroo rats were much hotter than previously thought. Rodents, especially kangaroo rats and antelope squirrels (Walsberg 2000) have high critical thermal maxima with the Ord’s kangaroo rat (Dipodomys ordii) body temperature reaching 45.0°C (Erskine and Hutchison 1982) and the white-tailed antelope squirrel (Ammospermophilus leucurus) up to 43.6°C (Chappell and Bartholomew 1981) before lethality. Therefore, the maximum temperatures recorded in our simulated burrows likely could be tolerated by giant kangaroo rats and San Joaquin antelope squirrels for which these burrows were intended to emulate. Also, giant kangaroo rats do not wait for evening air temperatures to moderate to become active. Almost all individuals are most active immediately at twilight, even in the summer (Braun 1985; Randall et al. 2002), when above ground air temperatures are still very high although heat from solar insolation is lower at twilight than during the day. Individuals are only active above ground for about 2 h of the night (Braun 1985; Randall et al. 2002).
Throughout the world, many small to medium-sized mammals construct burrow systems (Kinlaw 1999; Burda et al. 2007). Burrows offer protection from predators and can allow for guarding of food resources (Shaw 1934; Kinlaw 1999; Burda et al. 2007; White and Geluso 2012). Especially in harsh environments, burrows also allow mammals to avoid lethal temperatures. For desert rodents, especially kangaroo rats that do not typically drink free water (Schmidt-Nielsen 1964; French 1992), low rates of evaporative water loss (Hart 1971; Hinds and McMillen 1985) coupled with high humidity in burrows allows for survival in a habitat that otherwise would prove inhospitable. We found, using 40 replicates and over 3.5 years, that burrows in the San Joaquin Desert of Southwestern USA provide more equitable and moderate temperatures and humidity than above-ground conditions for the desert rodents that occur there, and that cattle grazing improves the microclimate of burrows compared to areas densely covered by herbaceous plants.
Acknowledgments
We thank the late G. Rathbun for helping with placement of data loggers and discussion of study methods. We also thank E. Cypher who supplied the list of plants at the study site. This study was conducted under federal permit #TE749872 and a California Scientific Collecting Permit and Memorandum of Understanding.
Literature Cited
- Baldo, M. B., C. D. Antenucci, and F. Luna. 2015. Effect of ambient temperature on evaporative water loss in the subterranean rodent Ctenomys talarum. Journal of Thermal Biology 53:113–118.
- Braun, S. E. 1985. Home range and activity patterns of the giant kangaroo rat, Dipodomys ingens. Journal of Mammalogy 66:1–12.
- Brickner-Braun, I., D. Zucker-Milwerger, A. Braun, J. Scott Turner, B. Pinshow, and P. Berliner. 2014. Ventilation of multi-entranced rodent burrows by boundary layer eddies. Journal of Experimental Biology 217:4141–4148.
- Burda, H., R. Šumbera, and S. Begall. 2007. Microclimates in burrows of subterranean rodents – revisited. Pages 21–33 in S. Begall, H. Burda, and C. E. Schleich, editors. Subterranean Rodents. Springer, Berlin, Germany.
- Chappell, M. A., and G. A. Bartholomew. 1981. Activity and thermoregulation of the antelope ground squirrel Ammospermophilus leucurus in winter and summer. Physiological Zoology 54:215–223.
- Cypher, B. L. 2001. Spatiotemporal variation in rodent abundance in the San Joaquin Valley, California. Southwestern Naturalist 46:66–75.
- Cypher, B. L. 2024. The San Joaquin Kit Fox. Biology, Ecology, and Conservation of an Endangered Species. Cornell University Press, Ithaca, NY, USA.
- Dallman, P. R. 1998. Plant Life in the World’s Mediterranean Climates. University of California Press, Berkeley, CA, USA.
- D’Antonio, C. M., and P. M. Vitousek. 1992. Biological invasions by exotic grasses, the grass/fire cycle, and global change. Annual Review of Ecology and Systematics 23:63–87.
- Edelman, A. J. 2011. Kangaroo rat remodel burrows in response to seasonal changes in environmental conditions. Ethology 117:430–439.
- Erskine, D. J., and V. H. Hutchison. 1982. Critical thermal maxima in small mammals. Journal of Mammalogy 63:267–273.
- French, A. R. 1993. Physiological ecology of the Heteromyidae: economics of energy and water utilization. Pages 509–538 in H. H. Genoways and J. A. Brown, editors. Biology of the Heteromyidae. Special Publication No. 10, American Society of Mammalogists, Provo, UT, USA.
- Fusco, E. J., J. K. Balch, A. L. Mahood, R. C. Nagy, A. D. Syphard, and B. A. Bradley. 2021. The human-grass-fire cycle: how people and invasives co-occur to drive fire regimes. Frontiers in Ecology and the Environment 20:117–126. https://doi.org/10.1002/fee.2432
- Garbowski, M., D. B. Johnston, D. V. Baker, and C. S. Brown. 2021. Invasive annual grass interacts with drought to influence plant communities and soil moisture in dryland restoration. Ecosphere 12(3):e03417. https://doi.org/10.1002/ecs2.3417
- Germano, D. J., and W. M. Rhodehamel. 1995. Characteristics of kangaroo rat burrows in fallow fields of the southern San Joaquin Valley. Transactions of the Western Section of The Wildlife Society 31:40–44.
- Germano, D. J., and L. R. Saslaw. 2017. Rodent community dynamics as mediated by environment and competition at a site in the San Joaquin Desert. Journal of Mammalogy 98:1615–1626.
- Germano, D. J., G. B. Rathbun, and L. R. Saslaw. 2001. Managing exotic grasses and conserving declining species. Wildlife Society Bulletin 29:551–559.
- Germano, D. J., G. B. Rathbun, L. R. Saslaw, B. L. Cypher, E. A. Cypher, and L. Vredenberg. 2011. The San Joaquin Desert of California: ecologically misunderstood and overlooked. Natural Areas Journal 31:138–147.
- Germano, D. J., G. B. Rathbun, and L. R. Saslaw. 2012. Effects of grazing and invasive grasses on desert vertebrates in California. Journal of Wildlife Management 76:670–682.
- Goldingay, R. L., P. A. Kelly, and D. F. Williams. 1997. The kangaroo rats of California: endemism and conservation of keystone species. Pacific Conservation Biology 3:47–60.
- Hart, J. S. 1971. Rodents. Pages 1–49 in G. C. Whittow, editor. Comparative Physiology of Thermoregulation, Volume 2. Academic Press, New York, NY, USA.
- Hastie, T. 1992. Generalized additive models. Chapter 7 in S. J.M. Chambers and T.J. Hastie, editors. Statistical Models. Chapman and Hall, Pacific Grove, CA, USA.
- Hastie, T. 2020. gam: Generalized Additive Models. R package version 1.20. https://CRAN.R-project.org/package=gam
- Hawbecker, A. C. 1953. Environment of the Nelson antelope ground squirrel. Journal of Mammalogy 34:324–334.
- Hinds, D. S., and R. E. McMillen. 1985. Scaling of energy metabolism and evaporative water loss in heteromyid rodents. Physiological Zoology 58:282–298.
- Jones, Z. F., C. E. Bock, and J. H. Bock. 2003. Rodent communities in a grazed and ungrazed Arizona grassland, and a model of habitat relationships among rodents in southwestern grass/shrublands. American Midland Naturalist 149:384–394.
- Kay, F. R. 1975. Environmental physiology of the banner-tailed kangaroo rat. I. Influences of ambient temperature, humidity, and carbon dioxide on body temperature. Comparative Biochemical Physiology 50A:483–488.
- Kay, F. R., and W. G. Whitford. 1978. The burrow environment of the banner-tailed kanaroo rat, Dipodomys spectabilis, in south-central New Mexico. American Midland Naturalist 99:270–279.
- Kenagy, G. J. 1973. Daily and seasonal patterns of activity and community energetics in a heteromyid rodent community. Ecology 54:1201–1219.
- Kinlaw, A. 1999. A review of burrowing by semi-fossorial vertebrates in arid environments. Journal of Arid Environments 41:127–145.
- Langsford, A. 1983. Pattern of nocturnal activity of male Dipodomys ordii (Heteromyidae). Southwestern Naturalist 28:341–346.
- Levine, J. M., M. Vila, C. M. D’Antonio, J. S. Dukes, K. Grigulis, and K., and S. Lavorel. 2003. Mechanisms underlying the impacts of exotic plant invasions. Proceedings of the Royal Society of London B 270:775–781.
- Mahood, A. L., R. O. Jones, D. I. Board, J. K. Balch, J. C. Chambers. 2022. Interannual climate variability mediates changes in carbon and nitrogen pools caused by annual grass invasion in a semiarid shrubland. Global Change Biology 28:267–284.
- Milling, C. R., J. L. Rachlow, M. A. Chappell, M. J. Camp, T. R. Johnson, L. A. Shipley, D. A. Paul, and J. S. Forbey. 2018. Seasonal temperature acclimatization in a semi-fossorial mammal and the role of burrows as thermal refuges. PeerJ 6:e4511. https://doi.org/10.7717/peerj.4511
- Minnich, R. A., 2008. California’s Fading Wildflowers: Lost Legacy and Biological Invasions. University of California Press, Berkeley, CA, USA.
- Price, M. V. 1978. The role of microhabitat in structuring desert rodent communities. Ecology 59:910–921.
- Randall, J. A., E. V. Hekkala, L. D. Cooper, and J. Barfield. 2002. Familiarity and flexible mating strategies of a solitary rodent, Dipodomys ingens. Animal Behaviour 64:11–21.
- Schimdt-Nielsen, K. 1964. Desert Animals: Physiological Problems of Heat and Water. Clarendon Press, Oxford, UK.
- Schmidt-Nielsen, B., and K. Schmidt-Nielsen. 1950. Evaporative water loss in desert rodents in their natural habitat. Ecology 31:75–85.
- Seabloom, E. W., E. T. Borer, Y. Buckley, E. E. Cleland, and K. Davies. 2013. Predicting invasion in grassland ecosystems: is exotic dominance the real embarrassment of riches? Global Change Biology 19:3677–3687.
- Shaw, W. T. 1934. The ability of the giant kangaroo rat as a harvester and storer of seeds. Journal of Mammalogy 15:275–286.
- Single, J. R., D. J. Germano, and M. H. Wolfe. 1996. Decline of kangaroo rats during a wet winter in the southern San Joaquin Valley, California. Transactions of the Western Section of The Wildlife Society 32:34–41.
- Soholt, L. F. 1974. Environmental conditions in an artificial burrow occupied by Merrriam’s kangaroo rat, Dipodomys merriami. Journal of Mammalogy 55:859–864.
- Soil Conservation Service. 1988. Soil survey of Kern County, California, northwestern part. U.S. Department of Agriculture, Soil Conservation Service. Washington, D.C., USA.
- Studier, E. H., and T. P. Baca. 1968. Atmospheric conditions in artificial burrows. Southwestern Naturalist 13:401–410.
- Tracy, R. L., and G. E. Walsberg. 2002. Kangaroo rats revisited: re-evaluating a classic case of desert survival. Oecologia 133:449–457.
- van Jaarsveld, B., N. C. Bennett, R. Kemp, et al. 2021. Heat tolerance in desert rodents is correlated with microclimate at inter- and intraspecific levels. Journal of Comparative Physiology B 191:575–588.
- Vitousek, P. M., C. M. D’Antonio, L. L. Loope, M. Rejmanek, and R. Westbrooks. 1997. Introduced species: a significant component of human-caused global change. New Zealand Journal of Ecology 21:1–16.
- Vorhies, C. T. 1945. Water Requirements of Desert Animals in the Southwest. Technical Bulletin No. 107. University of Arizona, Tucson, AZ, USA.
- Walsberg, G. E. 2000. Small mammals in hot deserts: some generalizations revisited. Bioscience 50:109–120.
- White, J. A., and K. Geluso. 2012. Seasonal link between food hoarding and burrow use in a nonhibernating rodent. Journal of Mammalogy 93:149–160.
- Williams, D. F., and K. S. Kilburn. 1991. Dipodomys ingens. Mammalian Species 377:1–7.
- Wilson, K. J., and D. L. Kilgore, Jr. 1978. The effects of location and design on the diffusion of respiratory gases in mammal burrows. Journal of Theoretical Biology 71:73–101.
- Wood, S. N. 2011. Fast stable restricted maximum likelihood and marginal likelihood estimation of semiparametric generalized linear models. Journal of the Royal Statistical Society (B) 73:3–36.