

FULL RESEARCH ARTICLE
Zachary A. Schakner1*, Daniel Studt2, Elizabeth A. Hellmers3, and Maren L. Levine4
1 National Oceanic and Atmospheric Administration, National Marine Fisheries Service, Office of Science and Technology, 1315 East-West Highway, SSMC3, Silver Spring, MD 20910, USA ![]() https://orcid.org/0000-0002-8325-3526
https://orcid.org/0000-0002-8325-3526
2 National Oceanic and Atmospheric Administration, West Coast Region, 501 West Ocean Boulevard, Suite 4200, Long Beach, CA 90650, USA
3 California Department of Fish and Wildlife, Marine Region, 8901 La Jolla Shores Drive, La Jolla, CA 92037, USA ![]() https://orcid.org/0000-0001-6271-4023
https://orcid.org/0000-0001-6271-4023
4 Independent researcher
*Corresponding Author: zachary.schakner@noaa.gov
Published 6 June 2024 • doi.org/10.51492/cfwj.110.7
Abstract
The resurgence of pinniped populations along the West Coast of the United States, a consequence of the Marine Mammal Protection Act, has resulted in unintended ecological and socio-economic repercussions. The conflict between pinniped and fisheries in California, a persistent management challenge for decades, primarily manifests as depredation (the removal or damage of hooked fish) from Commercial Passenger Fishing Vessels (CPFVs). Depredation not only results in stolen fish but also in lost fishing opportunities due to the presence of pinnipeds deterring target fish species or necessitating vessel relocation. Using logbook data from 1994 to 2021, we explored spatiotemporal trends in pinniped depredation of CPFVs in California. Our model, which evaluates the factors predicting the number of fish depredated, revealed a distinct concentration of pinniped depredation in Southern California, with increasing rates of depredation during summer and spring. Over our time series, depredation is decreasing, as our model found a seven percent decrease in the number of fish depredated each calendar year. Correspondingly, changepoint and trend analysis revealed two key trend reversals in 1999 and 2014, exemplified by a rapid peak and ensuing drop in overall depredation. Overall, our study suggests that depredation is shaped by an interplay of environmental factors, the population dynamics of pinnipeds, and the patterns of fishing activities within the California current ecosystem.
Key words: California, marine mammal depredation, pinniped-fishery conflict, recreational fisheries
| Citation: Schakner, Z. A., D. Studt, E. A. Hellmers, and M. L. Levine. 2024. Trends in pinniped interactions with commercial passenger fisheries vessels in California. California Fish and Wildlife Journal 110:e7. |
| Editor: Morgan Ivers-Duran, Marine Region |
| Submitted: 15 September 2023; Accepted: 7 March 2024 |
| Copyright: ©2024, Schakner et al. This is an open access article and is considered public domain. Users have the right to read, download, copy, distribute, print, search, or link to the full texts of articles in this journal, crawl them for indexing, pass them as data to software, or use them for any other lawful purpose, provided the authors and the California Department of Fish and Wildlife are acknowledged. |
| Competing Interests: The authors have not declared any competing interests. |
Introduction
Pinniped population abundance has increased substantially across the West Coast of the United States in the past several decades (Brown et al. 2005; Laake et al. 2018; Carretta et al. 2022). There are six species of pinnipeds found off the coast of California: California sea lion (Zalophus californianus), Pacific harbor seal (Phoca vitulina), Stellar sea lion (Eumetopias jubatus), Northern fur seal (Callorhinus ursinus), Guadalupe fur seal (Arctocephalus townsendi), and Northern elephant seal (Mirounga angurstirostri) (CDFG 2001). While earlier legislation for the protection of specific marine mammals (i.e., the Whaling Convention Act of 1946 and the Fur Seal Act of 1966) had been adopted, the Marine Mammal Protection Act (MMPA) of 1972 was the first legislation to mandate an ecosystem-based approach to marine resource management as well as provide comprehensive and wide-ranging protections for all marine mammal species in US waters (NMFS 2024). These species have since experienced population growth, and the recovery of pinniped species in California is a conservation success story. While pinniped population abundances have increased substantially due to the MMPA, expanding populations along the West Coast have had unintended consequences (Marshall et al. 2015; Chasco et al. 2017). Growing pinniped populations may have ecosystem-wide effects due to increased predation pressure on forage fish (Thompson et al. 2016; Jusufovski et al. 2019). In addition, expanding populations create management conflicts, such as the consumption of endangered salmonid species, competitive interactions with fisheries, and damage to docks, live bait pens, and personal vessels (Scordino 2010; Chasco et al. 2017; Schakner et al. 2019). In the Pacific Northwest, pinniped predation accounts for more Chinook salmon (Oncorhynchus tshawytscha) mortality than all fisheries combined (Chasco et al. 2017; Wargo Rub et al. 2019).
In California, conflicts between pinnipeds and recreational fisheries are particularly acute and have been an ongoing management issue for decades (Hanan et al. 1989; Beeson and Hanan 1996; Fluharty 1999). These conflicts most often occur in the form of depredation (the removal or damaging of hooked fish–both bait and target species) but also as lost fishing opportunities. Not only are fishing opportunities compromised by the presence of pinnipeds, as they often scare away target fish species, but their presence also contributes to time lost to move vessels away from or to deter pinnipeds. California sea lions (CSL) are the main pinniped species engaged in depredation and interactions with fisheries, though harbor seals may interact with fisheries infrequently (Beeson and Hanan 1996; Scordino 2010).
Commercial Passenger Fishing Vessels (CPFVs), also referred to as “charter fishing vessels,” “sportfishing vessels,” or “six-packs,” are any coastal or offshore vessel used for sport fishing, charter fishing, or any other type of fishing activity where individuals (other than the owners or operators of the vessel) are on board and pay a fee to perform fishing activities. The CPFV fleet provides recreational anglers who do not have a private boat the opportunity to fish on partial, full, overnight, or multi-day trips, which may traverse in and out of California and U.S.-regulated waters. They are considered commercial fishing vessels, must possess specific state and federal permits, and must submit logbooks for all fishing activity. The fleet is unique in its long history, size, and the amount of revenue it generates (Dodson and Charter 2003; Bellquist et al. 2017). Thousands of anglers use CPFVs daily, which generate billions of dollars for local economies (NMFS 2022). The species of fish targeted and caught by CPFVs vary geographically, with a clear distinction between Northern/Central and Southern California as indicated by catch composition and the species listed on the CFPV logbook forms (Dodson and Charter 2003; CDFW 2022a; Figs. S1 and S2 (PDF)). Southern California CPFVs generally catch a variety of species such as Pacific bonito (Sarda chiliensis), tunas (Thunnus spp.), California yellowtail (Seriola lalandi), Pacific barracuda (Sphyraena argentea), and Pacific mackerel (Scomber japonicus), as well as rockfishes (Sebastes spp.) and several basses (Paralabrax spp.) (Dodson and Charter 2003). Whereas, Central and Northern CPFVs primarily catch species such as Chinook salmon (Oncorhynchus tshawytscha), striped bass (Morone saxatilis) and rockfishes (Dodson and Charter 2003).
Conflicts with pinnipeds are among the most contentious issues facing recreational anglers in California. While depredation occurs during private vessel and CPFV trips, only CPFV logbooks require depredation data for all trips, whereas private vessel anglers are only requested to provide such information for trips in which salmon are targeted (CDFW 2020). Pinniped and CPFV interactions result in lose-lose outcomes for all involved. Interactions lead to lost catch and bait, damaged fish (often discarded overboard), entanglement/ingestion of gear by pinnipeds, direct socio-economic losses for fisheries (e.g., avoidance costs, damaged and lost gear), potential behavioral changes in the pinnipeds, and deterrent and retaliatory actions by anglers. CPFVs incur negative economic impacts from the loss of fish (such as the loss of the specific commodity and subsequent loss of monetary gratuity to the crew for fish cleaning services or reduction in the number of anglers utilizing the CPFV), as well as the costs of fuel and time spent traveling to new fishing areas to avoid or deter pinnipeds. Additionally, the depredation of Chinook salmon may pressure their stocks, some of which are endangered and in recovery, and reduce fishing opportunities, posing an existential management concern (Weise and Harvey 1999, 2005). While not a new problem (Briggs and Davis 1972; Miller et al. 1983), depredation is pervasive and persistent, with little understanding of recent spatiotemporal trends.
In this study, we used CPFV logbook data from 1994 to 2021 to explore which factors influence rates and trends in overall pinniped depredation. Specifically, we analyzed logbook data from the California CPFV fleet to determine trends in depredation, identify the species most targeted by pinnipeds, and determine whether there are regional and seasonal depredation patterns within California.
Methods
CPFV Logbook Data
To explore the effects of pinnipeds on recreational anglers, we analyzed CPFV logbook data from 1994 to 2021 provided by the California Department of Fish and Wildlife (CDFW). Under the California Code of Regulations (CCR) Title 14 §195, pursuant to §190, and §7923 and §8026 of the Fish and Game Code, the owner/operator of a CPFV must keep a logbook of fishing activities. A logbook must be completed each day (up to 24 hours) of fishing and submitted monthly. CPFV captains complete logbooks during and after the completion of the fishing trip. These logbooks provide a queryable dataset that spans from 1980 to the present, providing valuable data on catch and effort in the CPFV fleet for management purposes. In 1994, the logbook format was changed to add a “Lost to Seals” field (Beeson and Hanan 1996). In recent years, this has been updated to “Lost to Sea Lions” as it is generally recognized that fish are taken by CSL and, less frequently, other pinnipeds like harbor seals (CDFW 2022a). In 2015, CDFW rolled out an optional electronic logbook for the CPFV fleet (Fig. S3 (PDF)), and either paper or electronic logbooks are acceptable. The number of electronic logbooks submitted does not appear to affect the number of reported depredation events, and the percentage of logs with these events remains relatively consistent across the time series, with a slight decline between 2015 and 2022 (Fig. S4 (PDF)). While logbook compliance is less than 100%, this data set provides a valuable index for tracking catch, effort, and depredation in the CPFV fleet. Preliminary summarization of logbook data revealed an issue with data collected during the year 2000. While the total number of submitted logbooks and the total number of fish kept and released were consistent with preceding and subsequent years, the number of logbooks indicating a depredation event was anomalously low. In 2000, CDFW transferred the CPFV logbook dataset into a new data management system, and it is speculated there were data lost in error, specifically in the “Lost to Sea Lions” field, during that process (Joann Eres, CDFW, personal communication). Due to this, all data for the year 2000 was excluded from these analyses.
Data collected in the logbook includes the date of each fishing activity, the number of anglers, the total number of fish (by species) retained, released, and lost to sea lions, and the port of landing. While some captains will record pinniped species on paper logbooks, not all do, and the electronic logbook does not allow for differentiation. All pinniped interactions are grouped in the data, and it is not possible to break down interactions by individual pinniped species, but we assume the vast majority involve CSL.
Data Analysis
For all statistical analyses, we used R version 4.0.2 (www.r-project.org). To study factors that predicted the number of fish depredated (per month, aggregated by geographic region), we fitted a generalized linear model with negative binomial error distribution (GLM-nb). The model structure included the following predictor variables: total angler catch (number of fish kept plus number released), total fishing effort (number of vessel fishing days), region (based on California Recreation Fishery Survey districts; Northern [districts 5 and 6], Central [districts 3 and 4] or Southern California [districts 1 and 2]) determined by the county of the port of landing (see Fig. S5 (PDF)), and season (four seasons; fall was used as reference level). Season was defined as either Winter (December, January, and February), Spring (March, April, and May), Summer (June, July, and August), or Fall (September, October, and November). Significance was assessed using confidence intervals (CIs, 95%) calculated with the ‘confint’ function (method “Wald”) in lme4 (Bates et al. 2015). Model assumptions were evaluated based on the distribution of residuals, quantile-quantile plots, and plots of residuals versus fitted values (“DHARMa,” Hartig 2022; Supplemental Information (PDF)). All model parameter coefficients and CIs are shown on the scale of the response variable.
To explore trends in pinniped depredation, we used non-parametric tests to identify trends, and Mann-Kendall trend tests were used to assess the significance of the change (Mann 1945; Kendall 1975) using the package Kendall (McLeod 2011). We assessed the trend in total pinniped depredation (all fish species combined) and depredation by fish species using the top four species targeted by pinnipeds through time: California yellowtail, Pacific bonito, kelp bass, and Pacific barracuda. Historically, these species have made up a significant proportion of CPFV catch in Southern California (Dotson and Charter 2003). Additionally, we included trends in the depredation of a species of concern, Chinook salmon, the primary target species of Northern California CPFVs.
In addition, Bayesian time series decomposition was used to discern abrupt changepoints in trends for depredation (number of fish lost to pinnipeds) using the Bayesian Estimator of Abrupt change, Seasonal change, and Trend or ‘BEAST’ function in the Rbeast package v0.9.4 in R (Li et al. 2023). Rbeast identifies trends, likely changepoints (and credible intervals), and the estimated probability of such an occurrence over time. Trend is the given data, with the dashed line indicating a changepoint occurrence. The output of Pr(tcp) is the probability of the changepoint occurrence over time.
Results
Factors Influencing Depredation
We found that location, season, fishing effort (total vessel days fished), and calendar year predicted the number of fish depredated by pinnipeds per month (Table 1). Southern California was a clear hotspot for depredation, with a gradually decreasing prevalence of depredation northward. Compared to Southern California, Central California and Northern California experienced approximately 89% and 95% less depredation, respectively. We also found seasonal differences in depredation. Compared to fall, our model predicted 41% and 28% higher depredation during spring and summer, respectively (Table 1). The calendar year was also significant; on average, seven percent fewer fish were depredated each subsequent year since 1994. The metric for fishing effort (number of vessel days fished) was marginally significant, whereas total CPFV catch (retained and released) did not influence pinniped depredation (Table 1).
Table 1. General linear model predicting the factors influencing the number of monthly pinniped depredation reported by Commercial Passenger Fishing Vessel captains in California during 1994–2021. Model coefficients and confidence intervals are presented on the response variable’s scale. Significant variables are indicated with an asterix (*).
| Variable | Parameter Estimate | 95% CI |
|---|---|---|
| Total Vessel Days* | 1.00 | 1.00, 1.00 |
| Location: Central* | 0.11 | 0.09, 0.13 |
| Location: North* | 0.05 | 0.04, 0.06 |
| Year* | 0.93 | 0.93, 0.94 |
| Spring* | 1.41 | 1.22, 1.63 |
| Summer* | 1.28 | 1.10, 1.48 |
| Winter | 0.85 | 0.72, 1.03 |
| CPFV total catch (number of fish) | 1.00 | 1.00, 1.00 |
We did not find a significant trend in combined (all species), bonito, or yellowtail depredation during the study period (Table 2; Figs. 1–3). We did find, however, a significant, decreasing trend in barracuda and Chinook salmon depredation (Figs 4, 5). In contrast, kelp bass depredation increased significantly over the study period (Table 2; Fig. 6).
Table 2. Results of the Mann-Kendall trend test for depredation through time (by fish species). Significant values are indicated with an asterix (*). Results of the BEAST changepoint analysis displayed with the year of the trend reversal. NS denotes not significant for BEAST changepoint analysis.
| Fish Species | P-value | Trend | BEAST Changepoint (year) |
|---|---|---|---|
| All Species Combined | 0.2 | – | 1999, 2014 |
| Pacific Bonito | 0.06 | + | 2014 |
| California Yellowtail | 0.08 | + | 1999, 2015 |
| Pacific Barracuda | < 0.001* | – | NS |
| Kelp Bass | 0.02* | + | 2014 |
| Chinook Salmon | < 0.001* | – | 1999 |
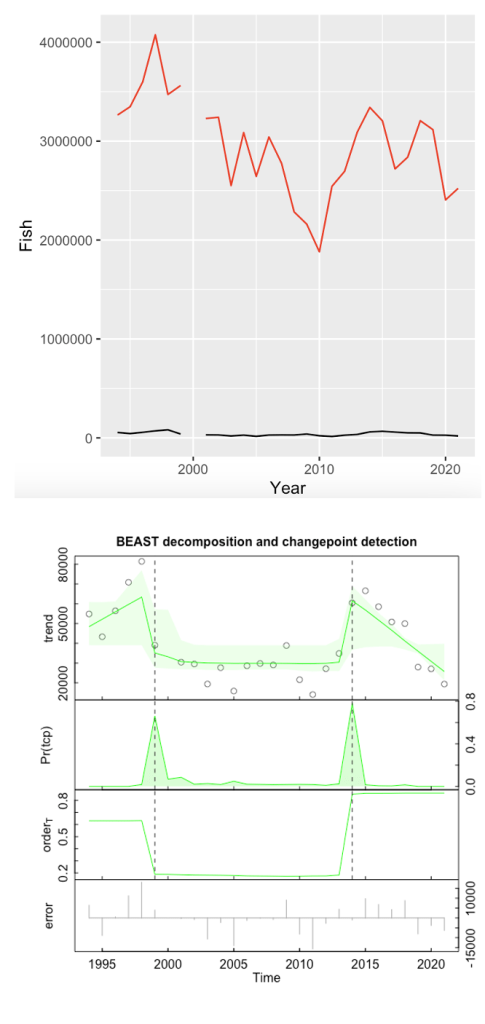
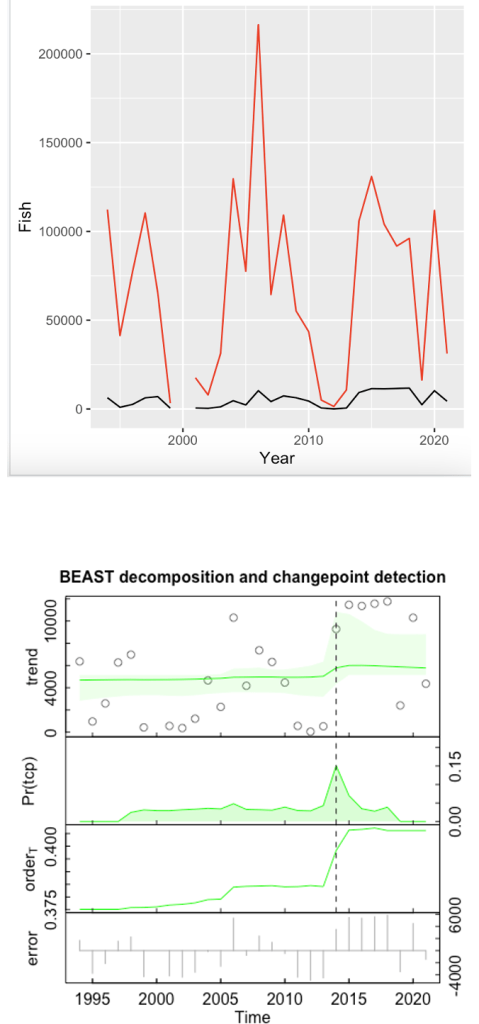

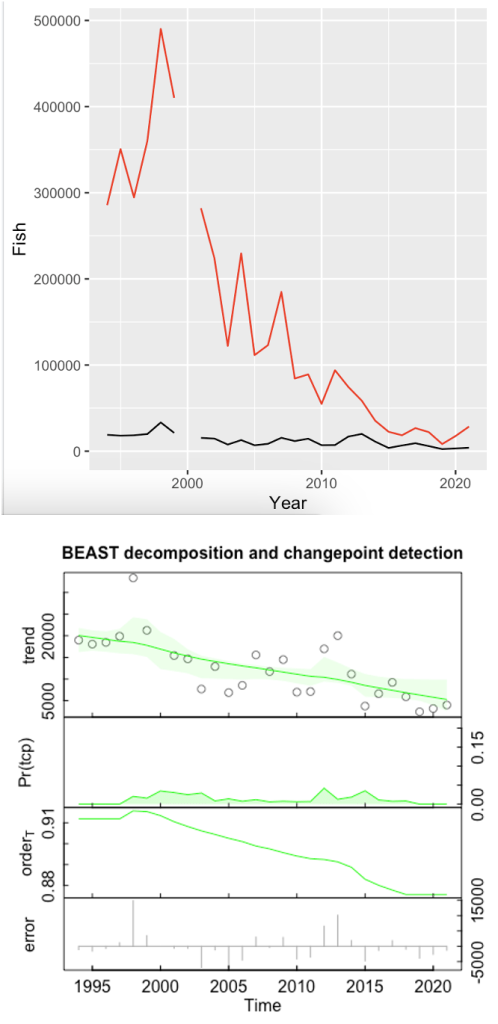
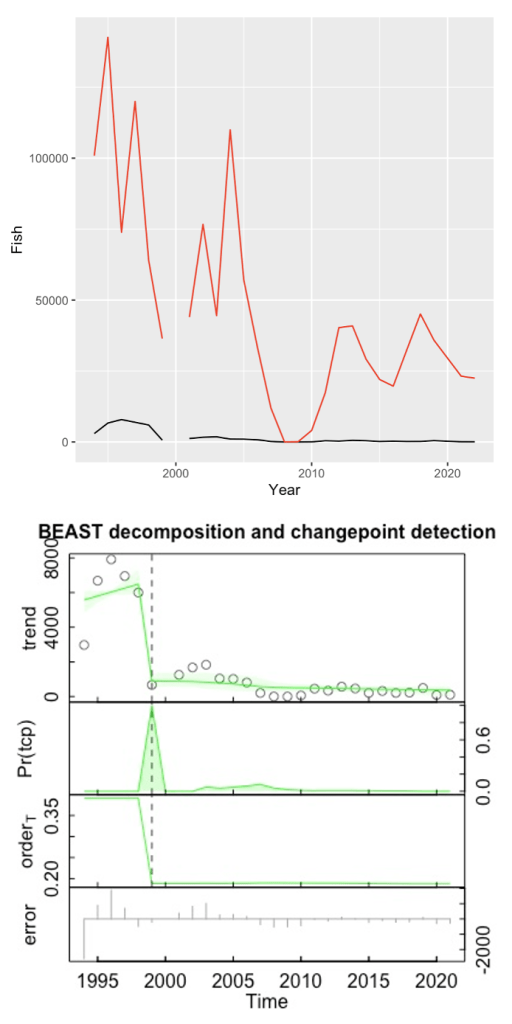
Figure 5. Annual Chinook salmon depredation (black line), Commercial Passenger Fishing Vessel catch (red line), and results of changepoint analysis conducted on annual depredation evaluated using the “Rbeast.” Due to a system error and resulting data loss, the year 2000 was excluded.
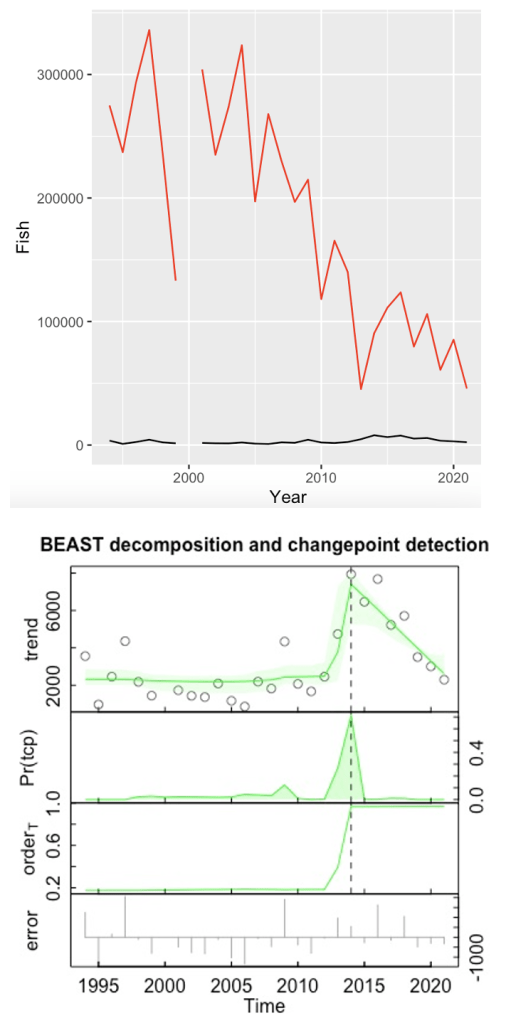
BEAST-based changepoint analysis revealed two significant changepoints in combined (all species) depredation in 1999 and 2014 (Fig. 1). The frequency of depredation peaked rapidly and then dropped substantially in each of these periods. Yellowtail depredation exhibited a similar pattern, with significant changepoints in 1999 and 2015 (Fig. 3). Changepoint analysis using BEAST revealed significant trend reversals in bonito and kelp bass depredation in 2014 (Figs. 2, 6). According to the BEAST changepoint analysis, the frequency of Chinook salmon depredation peaked rapidly in 1999 and dropped substantially (Fig. 5).
Discussion
We examined the spatiotemporal trends in pinniped depredation of CPFVs and factors influencing depredation rates in California using long-term logbook data compiled from 1994 to 2021. Further, we verified that numerous variables were associated with changes in depredation rates (Table 1). Our model confirms that Southern California is a hot spot for pinniped depredation on anglers fishing from CPFVs, especially compared to Central and Northern California, and pinniped depredation is strongly seasonal, with summer and spring months showing more fish depredated than in the fall and winter. Over our time series, depredation appears to be decreasing, as our model found a seven percent decrease in the number of fish depredated each calendar year. Correspondingly, changepoint and trend analysis revealed two key trend reversals in 1999 and 2014, exemplified by a rapid peak and ensuing drop in depredation. In general, our work suggests that depredation is influenced by a complex interplay of environmental factors, population dynamics of pinnipeds, and the behavior of fishing activities in the California current ecosystem.
California sea lions are the predominant depredator of CPFVs in California (Beeson and Hanan 1996; Scordino 2010). As a result, the observed trends in depredation appear to be at least partially influenced by their population dynamics. CSL exhibited near-exponential population growth for the past several decades, but this growth appears to have slowed recently. The latest population assessment for CSL (Caretta et al. 2022) found that the population may have reached carrying capacity in 2014, mirroring our documented peak in depredation and trend changepoint. Correspondingly, long-term monitoring of CSL pups shows abrupt declines in 1997/1998, 2009/2010, and 2013/2014 (Laake et al. 2018). Two of these rapid population declines coincide with our trend reversals in depredation (1999 and 2014; Fig. 1). These spikes in depredation signal that broader environmental conditions, dictating the availability and distribution of their primary prey, may influence pinniped fishery interactions.
There is an emerging body of evidence that during times of environmental change, CSL increasingly engage in depredation (Hanan et al. 1989; Weise and Harvey 2005; Keledjian and Mesnick 2013). Environmental change, driven by climate phenomena like El Niño, can disrupt the usual patterns of upwelling, leading to alterations in the abundance and distribution of CSL primary prey: fish and cephalopods (Fiedler et al. 1986; Leising et al. 2015). In response to decreased prey abundance, pinnipeds shift from their typical foraging ranges to locations farther offshore or to new foraging resources, such as fisheries (Boyd et al. 1994). We observed a higher frequency of fisheries interactions in two distinct years, 1999 and 2014. These were periods characterized by heightened but unique environmental stressors. The 1997–1998 El Niño event altered natural prey distribution (Lynn et al. 1998), caused a leveling of the population (Laake et al. 2018), whereas an oceanic heat wave [i.e., the Blob] in 2013–2015 (Leising et al. 2015; McClatchie et al. 2016) had a demonstrable negative impact on CSL juveniles and pregnant and lactating females (Melin et al. 2010, 2012). This forage decline contributed to many die-offs and stranded CSL pups, which resulted in NMFS declaring an “Unusual Mortality Event” along the California coast from 2013 through 2016 (NMFS 2021). A combination of environmental and population density-dependent factors, primarily affecting CSL, may have culminated in the sharp increase in depredation of catch over a short period of time observed during the 2014 changepoint. Subsequently, depredation decreased to a level of depredation similar to the 1999-2013 period. Fishing vessels appear to offer a potent, novel foraging resource that pinnipeds are likely to exploit if competition for local resources intensifies or the costs for other foraging opportunities are sufficiently high.
Our results confirm that anglers fishing from CPFVs based out of Southern California experience greater pinniped depredation of hooked fish (especially in summer and spring) compared to Central and Northern California. The simplest explanation is the direct spatiotemporal overlap between a large proportion of CPFV fishing effort and the high concentration of CSL congregating in the Channel Islands during the late spring and summer breeding season. Many CPFVs often target nearshore or coastal areas with structures like rocky reefs or kelp beds. In Southern California, these fishing locations likely provide easy access for CSL from their nearby onshore haul-out sites, as they commonly swim near or follow the vessels from the harbor or between fishing spots (Schakner and Blumstein 2021). While pinniped depredation is likely not as common on long-range and far offshore CPFV trips due to lower abundance of pinnipeds the farther from shore (Lowry and Carretta 1999; Melin and Delong 2000), there are observations of it in the logbook dataset. The loss of spatial resolution of CDFW fishing blocks far offshore and in Mexican waters makes it difficult to properly evaluate the rate of depredation events during these trips, as accurately determining the distance of reported fishing area from land becomes near impossible. Additionally, Point Conception is a natural biogeographical feature that differentiates the Southern California Bight from Central and Northern California, in that it affects oceanic conditions (i.e., temperature, currents). Specifically, it has been long believed to act as a barrier to many fish species’ geographic ranges through limitations to migrations, larval dispersal, food sources, etc. (Gaylord and Gaines 2000; Miller, 2023), and this geographic distinction may ultimately affect the fish species CPFVs target and thus pinniped patterns of depredation.
The contrasting patterns of CPFV catch and pinniped depredation of kelp bass may signal how fishing behavior influences pinniped behavior. Specifically, we observed an increasing trend of kelp bass depredation and an apparent decreasing trend in the CPFV catch of kelp bass. Our BEAST analysis revealed a significant changepoint in 2014, signaling a rapid increase in depredation that year (Fig. 6). This changepoint in depredation followed a regulatory change in 2013. This regulatory change implemented a reduced bag limit and increased minimum size limit (CDFW 2021) for kelp bass, ultimately resulting in an increase in catch-and-release fishing practices for this species. Released kelp bass may be an easy prey target for pinnipeds, potentially explaining the increase in kelp bass depredation over our time period. As an alternative explanation, captains may report the same fish as released and taken by sea lions on a logbook if a released fish is then observed to be depredated at the surface. However, it is not possible to determine the prevalence of double counting by either captains or pinnipeds. The patterns of kelp bass catch, and depredation provide insights into the interactions between fishing behavior and pinniped behavior.
Caveats—We note that while logbook data provide the best available information on depredation, it is limited by the accuracy of the captain/crew and appropriate logbook compliance. A potentially confounding factor in our analysis is that reporting depredation may have changed through time, thus influencing the observed rates. We recommend that researchers or observers regularly observe and quantify depredation from CPFVs in California.
The recovery of pinnipeds on the West Coast is a conservation success story that simultaneously poses challenges for protected marine mammal management and fisheries. Increasing pinniped populations create competitive interactions with fisheries directly through depredation and indirectly through predation (McClatchie et al. 2018; Cammen et al. 2019). The impacts of pinnipeds on California fish stocks compared to direct fishery takes have not been explored (Darimont et al. 2015), nor have the broader ecological consequences of pinniped recovery in the region. In the Pacific Northwest, pinniped predation accounts for more combined Chinook salmon mortality than all fisheries combined (Chasco et al. 2017; Wargo Rub et al. 2019). Depredation can have significant impacts; key consequences include reduced targeted species abundance, lower catch rates, and potential economic losses for fisheries (Miller et al. 1983; Weise and Harvey 2005; Scordino 2010; Chasco et al. 2017). Our research indicates that depredation is shaped by an intricate interaction of environmental factors, the population dynamics of pinnipeds, and the behavior of fishing activities within the California Current ecosystem.
Literature Cited
- Bates, D., M. Mächler, B. Bolker, and S. Walker. 2015. Fitting linear mixed-effects models using lme4. Journal of Statistical Software 67(1):1–48. https://doi.org/10.18637/jss.v067.i01
- Beeson, M. J., and D. A. Hanan. 1996. An evaluation of pinniped-fishery interactions in California. A Report to the Pacific States Marine Fisheries Commission, Sacramento, CA, USA.
- Bellquist, L., B. Semmens, S. Stohs, and A. Siddall. 2017. Impacts of recently implemented recreational fisheries regulations on the Commercial Passenger Fishing Vessel fishery for Paralabrax sp. in California. Marine Policy 86:134–143. https://doi.org/10.1016/j.marpol.2017.09.017
- Boyd, I. L., J. P. Y. Arnould, T. Barton, and J. P. Croxall. 1994. Foraging behavior of Antarctic fur seals during periods of contrasting prey abundance. Journal of Animal Ecology 63(3):703–713. https://doi.org/10.2307/5235
- Briggs, K. T., and C. W. Davis. 1972. A study of predation by sea lions on salmon in Monterey Bay. California Fish and Game 58:37–43.
- Brown, R. F., B. E. Wright, S. D. Riemer, and J. Laake. 2005. Trends in abundance and current status of harbor seals in Oregon: 1977–2003. Marine Mammal Science 21(4):657–670.
- California Department of Fish and Game (CDFG). 2001. California’s Living Marine Resources: A Status Report. California Department of Fish and Game, Sacramento, CA, USA. https://nrm.dfg.ca.gov/FileHandler.ashx?DocumentID=34324
- California Department of Fish and Wildlife (CDFW). 2020. 2020 CRFS sampler manual: California recreational fisheries survey. California Department of Fish and Wildlife, Sacramento, CA, USA. https://nrm.dfg.ca.gov/FileHandler.ashx?DocumentID=62348&inline
- California Department of Fish and Wildlife (CDFW). 2021. Kelp Bass, Paralabrax clathratus, Enhanced Status Report. California Department of Fish and Wildlife, Sacramento, CA, USA. https://marinespecies.wildlife.ca.gov/kelp-bass/
- California Department of Fish and Wildlife (CDFW). 2022a. California recreational fisheries survey methods. California Department of Fish and Wildlife, Sacramento, CA, USA. https://nrm.dfg.ca.gov/FileHandler.ashx?DocumentID=36136&inline
- California Department of Fish and Wildlife (CDFW). 2022b. Yellowtail, Seriola dorsalis (lalandi), Enhanced Status Report. California Department of Fish and Wildlife, Sacramento, CA, USA. https://marinespecies.wildlife.ca.gov/yellowtail/
- Carretta, J. V., E. M. Oleson, J. Baker, D. W. Weller, A. R. Lang, K. A. Forney, M. M. Muto, B. Hanson, A. J. Orr, H. Huber, M. S. Lowry, J. Barlow, J. E. Moore, D. Lynch, L. Carswell, and R. L. Brownell Jr. 2022. U.S. Pacific Marine Mammal Stock Assessments: 2022. U.S. Department of Commerce, NOAA Technical Memorandum NOAA-TM-NMFS-SWFSC-684. https://doi.org/10.25923/5ysf-gt95
- Cammen, K. M., D. B. Rasher, and R. S. Steneck. 2019. Predator recovery, shifting baselines, and the adaptive management challenges they create. Ecosphere 10(2). https://doi.org/10.1002/ecs2.2579
- Chasco, B. E., I. C. Kaplan, A. C. Thomas, A. Acevedo-Gutiérrez, D. P. Noren, M. J. Ford, M. B. Hanson, J. J. Scordino, S. J. Jeffries, K. N. Marshall, A. O. Shelton, C. Matkin, B. J. Burke, and E. J. Ward. 2017. Competing tradeoffs between increasing marine mammal predation and fisheries harvest of Chinook salmon. Scientific Reports 7(1):1–14.
- Darimont, C. T., C. H. Fox, H. M. Bryan, and T. E. Reimchen. 2015. The unique ecology of human predators. Science 349:858–860.
- Dotson, R. C., and R. L. Charter. 2003. Trends in the southern California sport fishery. California Cooperative Oceanic Fisheries Investigations Reports 44:94–106.
- Fiedler, P. C., R. D. Methot, and R. P. Hewitt. 1986. Effects of California El Nino 1982–1984 on the northern anchovy. Journal of Marine Research 44:317–338.
- Fluharty, M. J. 1999. California sea lion interactions with commercial passenger fishing vessel fisheries: a review of logbook data from 1994, 1995, and 1996. California Department of Fish and Wildlife, Marine Region Administrative Report 99(2).
- Gaylord, B., and S. D. Gaines. 2000. Temperature or transport? Range limits in marine species mediated solely by flow. American Naturalist 155:769–789. https://www.journals.uchicago.edu/doi/10.1086/303357
- Hanan, D. A., L. M. Jones, and R. B. Read. 1989. California sea lion interaction and depredation rates with the commercial passenger fishing vessel fleet near San Diego. California Cooperative Oceanic Fisheries Investigations Report 30:122–126.
- Hartig, F. 2022. DHARMa: Residual Diagnostics for Hierarchical (Multi-Level / Mixed) Regression Models. Available from: https://cran.r-project.org/web/packages/DHARMa/vignettes/DHARMa.html
- Jusufovski, D., C. Saavedra, and A. Kuparinen. 2019. Competition between marine mammals and fisheries in contemporary harvested marine ecosystems. Marine Ecology Progress Series 627:207–232. https://doi.org/10.3354/meps13068
- Kendall, M. G. 1975. Rank Correlation Methods. 4th edition. Charles Griffin, London, UK.
- Keledjian, A. J., and S. Mesnick. 2013. The impacts of El Niño conditions on California sea lion (Zalophus californianus) fisheries interactions: predicting spatial and temporal hotspots along the California coast. Aquatic Mammals 39(3):221–232.
- Laake, J. L., M. S. Lowry, R. L. Delong, S. R. Melin, and J. V. Carretta. 2018. Population growth and status of California sea lions. Journal of Wildlife Management 82:583–595. https://doi.org/10.1002/jwmg.21405
- Leising, A. W., I. D. Schroeder, S. J. Bograd, J. Abell, R. Durazo, G. Gaxiola-Castro, E. P. Bjorkstedt, J. Field, K. Sakuma, R. R. Robertson, R. Goericke, W. T. Peterson, R. Brodeur, C. Barceló, T. D. Auth, E. A. Daly, R. M. Suryan, A. J. Gladics, J. M. Porquez, S. McClatchie, E. D. Weber, W. Watson, J. A. Santora, W. J. Sydeman, S. R. Melin, F. P. Chavez, R. T. Golightly, S. R. Schneider, J. Fisher, C. Morgan, R. Bradley, and P. Warybok. 2015. State of the California Current 2014–15: Impacts of the warm-water “blob”. California Cooperative Oceanic Fisheries Investigations Reports 56:31–68.
- Li, Y., T. Hu, X. Zhang, K. Zhao, J. Dongarra, C. Moler, and M.K. Zhao. 2023. Package ‘Rbeast’. Available from: https://cran.r-project.org/web/packages/Rbeast/index.html
- Lowry, M. S., and J. V. Carretta. 1999. Market squid (Loligo opalescens) in the diet of California sea lions (Zalophus californianus) in southern California (1981–1995). California Cooperative Oceanic Fisheries Investigations Reports 40:196–207. https://calcofi.com/publications/calcofireports/v40/Vol_40_Lowry___Carretta.pdf.
- Lynn, R. J., C. A. Collines, A. W. Mantyla, F. B. Schwing, T. Baumgartner, T. L. Hayward, T. Murphree, K. M. Sakuma, J. Garcia, K. D. Hyrenbach, A. Shankle, and M. J. Tegner. 1998. The state of the California Current, 1997–1988: Transition to El Niño conditions. California Cooperative Oceanic Fisheries Investigations Reports 39:25–49.
- Mann, H. B. 1945. Nonparametric tests against trend. Econometrica 13:245–259. https://doi.org/10.2307/1907187
- Marshall, K. N., A. C. Stier, J. F. Samhouri, R. P. Kelly, and E. J. Ward. 2015. Conservation challenges of predator recovery. Conservation Letters 9:70–78. https://doi.org/10.1111/conl.12186
- McClatchie, S., R. D. Vetter, and I. L. Hendy. 2018. Forage fish, small pelagic fisheries and recovering predators: managing expectations. Animal Conservation 21(6):445–447. https://doi.org/10.1111/acv.12421
- McClatchie, S., J. Field, A. R. Thompson, T. Gerrodette, M. Lowry, P. C. Fiedler, W. Watson, K. M. Nieto, and R. D. Vetter. 2016. Food limitation of sea lion pups and the decline of forage off central and southern California. Royal Society Open Science 3:150628. https://doi.org/10.1098/rsos.150628
- McLeod, A. I. 2011. Kendall-package: Kendall correlation and trend tests. Available from: https://cran.r-project.org/web/packages/Kendall/index.html (Accessed January 2022)
- Melin, S. R., A. J. Orr, J. D. Harris, J. L. Laake, R. L. DeLong, F. M. D. Gulland, and S. Stoudt. 2010. Unprecedented mortality of California sea lion pups associated with anomalous oceanographic conditions along the central California coast in 2009. California Cooperative Oceanic Fisheries Investigations Reports 51:182–194.
- Melin, S. R., J. L. Laake, R. L. DeLong, and D. B. Siniff. 2012. Age-specific recruitment and natality of California sea lions at San Miguel Island, California. Marine Mammal Science 28(4):751–776. https://doi.org/10.1111/j.1748-7692.2011.00538.x
- Melin, S. R., and R. L. DeLong. 2000. At-sea distribution and diving behavior of California sea lion females from San Miguel Island, California. Pages 407–412 in D. R. Browne, K. L. Mitchell, and H. W. Chaney, editors. Proceedings of the Fifth California Islands Symposium. U.S. Department of Interior, Minerals Management Service, Camarillo, CA, USA. https://sbbotanicgarden.org/wp-content/uploads/2022/08/Melin_-DeLong-2002-Distribution_diving_behavior_female_seal-lion-1.pdf
- Miller, E. C. 2023. Historical biogeography supports Point Conception as the site of turnover between temperate East Pacific ichthyofaunas. PLoS ONE 18(9):e0291776. https://doi.org/10.1371/journal.pone.0291776
- Miller, D. J., M. J. Herder, and J. P. Scholl. 1983. California marine mammal-fishery interaction study, 1979–1981. Southwest Fisheries Science Center, Administrative Report LJ-83-13C, National Marine Fisheries Service, La Jolla, CA, USA. https://repository.library.noaa.gov/view/noaa/26652
- National Marine Fisheries Service (NMFS). 2021. 2013–2016 California sea lion unusual mortality event in California. Available from: https://www.fisheries.noaa.gov/national/marine-life-distress/2013-2016-california-sea-lion-unusual-mortality-event-california (Accessed 11 December 2023)
- National Marine Fisheries Service (NMFS). 2022. Fisheries Economics of the United States, 2019. Technical Memorandum NMFS-F/SPO-229, U.S. Department of Commerce, National Oceanic and Atmospheric Administration, Washington D.C., USA.
- National Marine Fisheries Service (NMFS). 2024. Law and Policies: Marine Mammal Protection Act. Available from: https://www.fisheries.noaa.gov/topic/laws-policies/marine-mammal-protection-act (Accessed 11 January 2024)
- Schakner, Z., C. Purdy, and D. T. Blumstein. 2019. Contrasting attitudes and perceptions of California sea lions by recreational anglers and the media. Marine Policy 109:103710. https://doi.org/10.1016/j.marpol.2019.103710
- Schakner, Z., and D. T. Blumstein. 2021. The California sea lion: thriving in a human-dominated world. Pages 347–365 in C. Campagna and R. Harcourt, editors. Ethology and Behavior Ecology of Otariids and the Odobenid. Springer, Cham, Switzerland.
- Scordino, J. 2010. West Coast pinniped program investigations on California sea lion and Pacific harbor seal impacts on salmonids and other fishery resources. Pacific States Marine Fisheries Commission, Portland, OR, USA.
- Wargo Rub, A. M., N. A. Som, M. J. Henderson, B. P. Sandford, D. M. Van Doornik, D. J. Teel, M. Tennis, O. P. Langness, B. K. van der Leeuw, D. D. Huff. 2019. Changes in adult Chinook salmon (Oncorhynchus tshawytscha) survival within the lower Columbia River amid increasing pinniped abundance. Canadian Journal of Fisheries and Aquatic Sciences 76(10):1862–1873. https://doi.org/10.1139/cjfas-2018-0290
- Weise, M. J., and J. T. Harvey. 1999. Food habits of California sea lions (Zalophus californianus) and their impact on salmonid fisheries in Monterey Bay, California. Report submitted to Fishermen’s Alliance of California. Technical Publication No. 99-01, Moss Landing Marine Laboratories, Moss Landing, CA, USA.
- Weise, M. J., and J. T. Harvey. 2005. Impact of the California sea lion (Zalophus californianus) on salmon fisheries in Monterey Bay, California. Fishery Bulletin 103(4):685–696.