

RESEARCH NOTE
Matt A. McKechnie1*, Terra Dressler2, Ethan Boucher Bell1, Ken Jarrett1, and Carolyn Geraghty3
1 Stillwater Sciences, 1203 Main Street, Morro Bay, CA 93442, USA![]() https://orcid.org/0009-0005-0946-8886 (MAM)
https://orcid.org/0009-0005-0946-8886 (MAM)
2 Stillwater Sciences, 996 S. Seaward Avenue, Suite 102, Ventura, CA 93001, USA![]() https://orcid.org/0000-0002-1794-4572
https://orcid.org/0000-0002-1794-4572
3 Morro Bay National Estuary Program, 601 Embarcadero, Morro Bay, CA 93442, USA
Published 22 May 2026 • doi.org/10.51492/cfwj.112.4
Key words: aquatic invasive species, invasive species management, Oncorhynchus mykiss, predation, Sacramento pikeminnow, steelhead
| Citation: McKechnie, M. A., T. Dressler, E. B. Bell, K. Jarrett, and C. Geraghty. 2026. Evaluation of an effort to manage invasive Sacramento pikeminnow to support steelhead recovery in a small coastal watershed. California Fish and Wildlife Journal 112:e4. |
| Editor: Dylan Stompe, Marine Region |
| Submitted: 5 December 2025; Accepted: 9 February 2026 |
| Copyright: ©2026, McKechnie et al. This is an open access article and is considered public domain. Users have the right to read, download, copy, distribute, print, search, or link to the full texts of articles in this journal, crawl them for indexing, pass them as data to software, or use them for any other lawful purpose, provided the authors and the California Department of Fish and Wildlife are acknowledged. |
| Funding: This project has been funded wholly or in part by the United States Environmental Protection Agency under assistance agreements CE-98T25101 and 4T-98T47301 to the Bay Foundation of Morro Bay. |
| Competing Interests: The authors have not declared any competing interests. |
Sacramento pikeminnow (Ptychocheilus grandis; hereafter referred to as “pikeminnow”) are native to the Sacramento-San Joaquin, Russian, and Salinas Rivers in California, USA. Following their introduction to Chorro Creek in the late 1970s, pikeminnow have established a persistent, self-sustaining population within this small coastal drainage that meets the ocean at Morro Bay, California. These invasive piscivores have deleterious effects on nearly all salmonid life stages through both direct (i.e., predation) and indirect (i.e., competitive exclusion) interactions which may be inhibiting the recovery of the native Oncorhynchus mykiss (steelhead/rainbow trout; herein referred to as O. mykiss) population (Brown and Moyle 1991; Brown and Moyle 1997; Brown and Brasher 1995; Nakamoto and Harvey 2003).
Chorro Creek is located on the California central coast of San Luis Obispo County (Fig. 1). The watershed drains 111 km2 and is unique among central California coast watersheds in that it is largely undeveloped, has perennial flows, and provides near year-round connectivity to a highly productive estuary, Morro Bay. Chorro Creek supports federally threatened O. mykiss belonging to the South-Central California Coast Distinct Population Segment. Snorkel surveys conducted in Chorro Creek in the early 2000s found no young-of-year (YOY) O. mykiss and low numbers of juvenile O. mykiss. The most abundant fish observed during the TRPA (2001) study was pikeminnow, and the absence of YOY O. mykiss was attributed to potential predation by pikeminnow. Pikeminnow suppression efforts were initiated in Chorro Reservoir in 2006 to address the source population and later expanded in 2008 to include Chorro Creek from the tidal extent upstream to Chorro Reservoir (Halligan and Otte 2011). Suppression efforts in Chorro Creek occurred annually from 2008–2010 and resulted in the reduction of adult pikeminnow; however, O. mykiss abundance was not monitored during these suppression efforts.

Within Chorro Creek, pikeminnow predation on O. mykiss has been confirmed through environmental DNA (eDNA) analysis of pikeminnow gut contents (Jarrett et al. 2019). In this study, O. mykiss DNA was detected within the gut contents of 18% of the sampled pikeminnow, indicating a substantial level of predation within the watershed. Consequently, the pikeminnow population represents a threat to the recovery of O. mykiss within Chorro Creek (NMFS 2013).
To address management objectives in the South-Central California Coast Steelhead Recovery Plan (NMFS 2013), and to aid in the recovery of the O. mykiss population, a Pikeminnow Management Plan was developed and implemented in 2017 (Stillwater Sciences 2017). Pikeminnow “management,” or “suppression,” is defined as the effort to remove pikeminnow from the watershed, such that their effect on native fishes is dampened. In this study, we evaluate whether a modestly funded pikeminnow management program can be effective at increasing O. mykiss abundance in the watershed.
We used a variety of control methods to suppress the pikeminnow population in Chorro Creek, including single-pass and multiple-pass backpack electrofishing, angling, and beach seining. Suppression efforts were conducted during the fall (late September–early November), when stream flows are at their lowest and pikeminnow are concentrated into smaller areas. The majority of the habitat in Chorro Creek during this time of the year is less than 1.2 m in depth, which facilitates efficient conditions for backpack electrofishing. To evaluate the efficacy of suppression efforts at limiting the pikeminnow population, and to assess annual trends in the abundance of O. mykiss and pikeminnow, we established multiple-pass depletion backpack electrofishing sites (i.e., index sites) throughout mainstem Chorro Creek within habitat units that contained suitable habitat for both species and had documented presence of pikeminnow (Stillwater Sciences 2017). Multiple-pass backpack electrofishing was conducted following methods by Pollock and Otto (1983) and the National Marine Fisheries Service (NMFS 2000) guidelines for electrofishing waters containing salmonids listed under the Endangered Species Act. Field activities were conducted under a California Department of Fish and Wildlife scientific collection permit (S-190250002-20023-001) and a National Marine Fisheries Service 10(a)1(A) permit (20085-3A). All captured O. mykiss and pikeminnow were measured to standard length (SL) and fork length (FL). Pikeminnow were humanely euthanized following methods included in the American Veterinary Medical Association (AVMA 2013) guidelines, and all other fish were returned to the stream after measuring.
The level of effort applied to pikeminnow suppression each year was constrained by available funding. EPA funds provided by the Morro Bay National Estuary Program and California Department of Fish and Wildlife Proposition 1 funding were matched with equipment donations from Stillwater Sciences. Field crews were staffed with Stillwater Sciences biologists as well as volunteers from the Watershed Stewards Program, California Conservation Corps, and community members. With an average field implementation budget of $22,000 per year, pikeminnow suppression efforts were implemented for an average of 10.5 days per year beginning in 2017. We were able to sample an average of 10 index sites per year, as well as conduct a variety of other control measures including single-pass backpack electrofishing, angling, and beach seining, capturing a total of 2,670 pikeminnow throughout mainstem Chorro Creek (Table 1).
Table 1. Level of effort and number of pikeminnow captured across each suppression year.
| Year | Field Implementation Budget | Number of Suppression Days | Linear Distance Sampled (m) | Pikeminnow Captured |
| 2017 | $7,200 | 6 | 347 | 224 |
| 2018 | $4,690 | 11 | 184 | 88 |
| 2019 | $8,000 | 9 | 1,128 | 218 |
| 2020 | $21,030 | 10 | 2,114 | 117 |
| 2021 | $37,818 | 12 | 3,427 | 191 |
| 2022 | $37,818 | 12 | 3,668 | 209 |
| 2023 | $37,818 | 14 | 3,610 | 1,027 |
| 2024 | $20,900 | 10 | 2,808 | 596 |
| Total | $175,274 | 84 | 17,286 | 2,670 |
Analyses were based on results from index sites that were sampled over multiple years and were conducted in R version 4.2.2 with a significance level of α = 0.05 for statistical tests. Abundance was estimated within index sites for each multiple-pass sampling event using depletion curves generated using the ‘FSA’ package (Ogle et al. 2025). Due to substantial variability in the size of index sites, fish densities were calculated by normalizing abundance estimates to unit length. Density (estimated abundance/100 m) was used as the dependent variable in models.
We used regression models to evaluate the density of pikeminnow and O. mykiss at index sites over time and to test for an overall relationship between pikeminnow density and O. mykiss density. Because the response variables consisted of count data with many zeros, we evaluated several candidate model structures. Model types testing O. mykiss density over time included linear regression and linear mixed effects models with a site identifier as a random effect (R package: lme4; Bates et al. 2015). Pikeminnow data trends indicated potential exponential relationships, so fish density and the natural log of fish density, ln(density), were both tested as dependent variables to compare the fit of linear vs exponential curves. These models were also tested against negative binomial regression, and zero-inflated negative binomial regression models (R package: glmmTMB; Brooks et al. 2017). Akaike information criterion (AIC) was used to select the best fit of all significant models. Pikeminnow are gape limited, and larger and older individuals are more piscivorous than younger and smaller individuals. Based on the results of the gut content analysis in Jarrett et al. (2019) and visual gut content observations in this study, pikeminnow in the Chorro Creek watershed are assumed to become piscivorous at age 1+; equivalent to 70 mm SL or larger. Therefore, in this study age 1+ and older pikeminnow (>70 mm SL; herein referred to as “large” pikeminnow) were assessed separately from YOY pikeminnow (≤70 mm SL). Index sites where pikeminnow were never captured were excluded from this analysis.
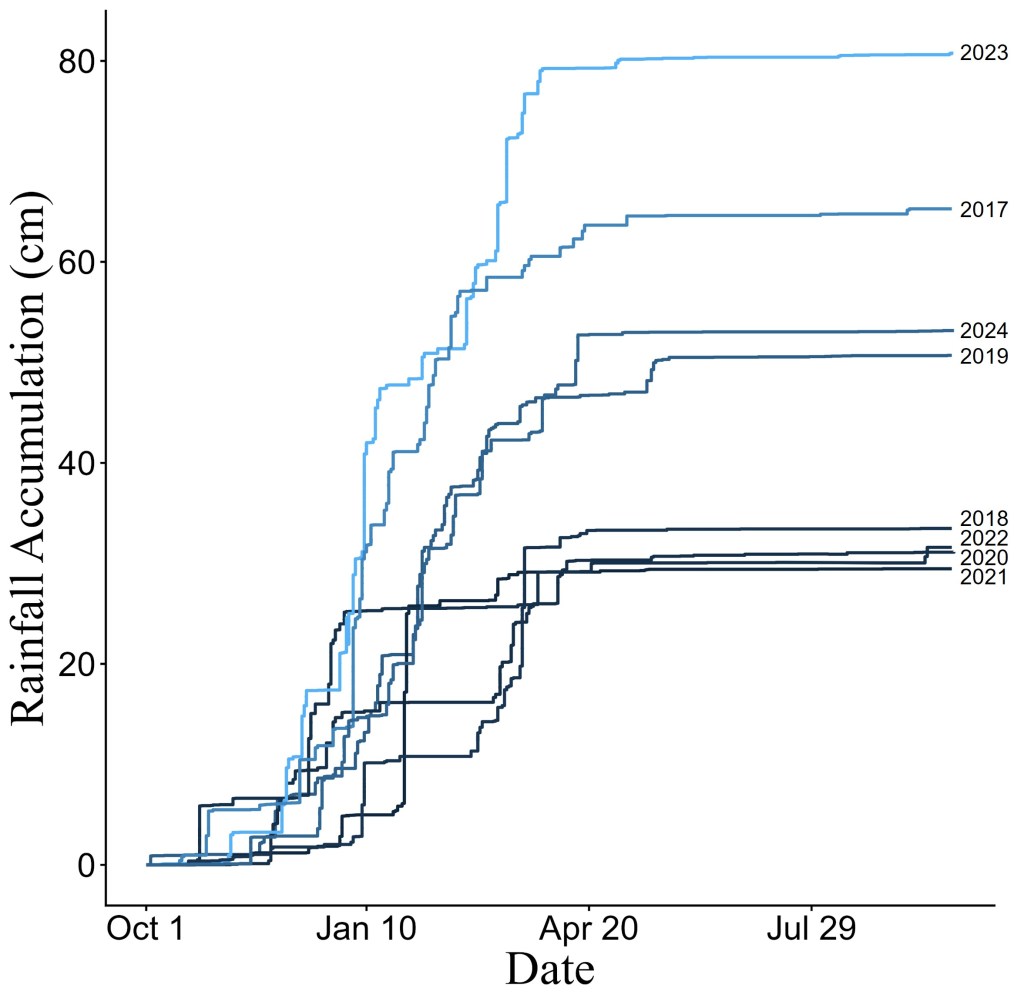
Rainfall corresponding to each sample year was also tested within these models as an additional fixed effect to assess the potential influence of environmental conditions on pikeminnow densities. Rainfall data was sourced from a San Luis Obispo County stream gage located in the watershed (Canet station 747; Fig. 1), and rainfall accumulation (cm) was calculated for the water year (starting 1 October) immediately preceding each suppression event. Rainfall accumulation varied between years, ranging from 29.5–80.9 cm (Table 2).
Table 2. Annual rainfall (cm) according to the San Luis Obispo County stream gage (Canet station 747) in San Luis Obispo County, CA, USA, for the water years (1 October–30 September) immediately preceding each suppression event.
| Year | Annual rainfall (cm) |
| 2017 | 65.3 |
| 2018 | 33.5 |
| 2019 | 50.7 |
| 2020 | 31.1 |
| 2021 | 29.5 |
| 2022 | 31.6 |
| 2023 | 80.9 |
| 2024 | 53.2 |
| Average Annual Rainfall | 47.0 |
Data from suppression efforts over the 2017 to 2024 period show that YOY O. mykiss (<120 mm FL) density did not exhibit an overall relationship with year (linear mixed effects model; χ2 = 0.52, df = 1, P = 0.473). However, pairwise comparison between years revealed that YOY O. mykiss density increased significantly after the initiation of suppression efforts in year 1, 2017, and remained elevated between years 2–6 before declining again in year 7, 2023 (linear mixed effects model; χ 2 = 21.21, df = 7, P = 0.003; Fig. 2). Importantly, 2023 and 2017 had the highest annual rainfall of all suppression years (Table 2). YOY O. mykiss emerge from spawning gravels in the spring (NMFS 2013), following the period of time when the majority of rainfall occurs in this system (Fig. 3). It is possible that high flows during 2017 and 2023 caused emerging O. mykiss to become displaced downstream, contributing to lower YOY O. mykiss densities in index sites later in the year. Density of age 1+ O. mykiss (≥120 mm) did not differ between years (linear mixed effects model; χ 2 = 10.55, df = 7, P = 0.159; Fig. 2).

YOY pikeminnow density exhibited a significant exponential decline over time (linear mixed effects model; χ 2 = 30.8, df = 1, P < 0.001) while rainfall had a significant positive effect on YOY pikeminnow density (χ 2 = 58.4, df = 1, P < 0.001), so both of these variables were included in the final model (Fig. 4). Large pikeminnow density did not appear to change over time when density was compared between calendar years (i.e., 2017, 2018, etc.). Because larger individuals are rarer than YOY and less likely to inhabit pools that meet depth requirements for effective electrofishing depletion, the initial sampling design was likely insufficient for detecting change in large pikeminnow density. In fact, only 2 of the index sites originally sampled in 2017 contained large pikeminnow. Therefore, additional index sites were added as the project progressed, including sites located closer to the source population (Fig. 1). When large pikeminnow density was modeled against suppression year (i.e., the number of years suppression has taken place at a given index site) rather than calendar year, density displayed a modest but significant exponential decline over time (linear regression; F = 4.82, df = 1, R2 = 0.09, p = 0.033; Fig. 5). Rainfall was not found to have a significant effect on large pikeminnow density, and its inclusion did not improve model fit, so it ultimately was dropped from the final model.


Overall O. mykiss densities (YOY and age 1+ combined) had an inverse relationship to overall pikeminnow densities within index sites (linear regression; F = 8.27, df=3, R2 = 0.25, p < 0.001; Fig. 6). Rainfall and the interaction between rainfall and pikeminnow density were significant additional fixed effects in this model.

Figure 6. Estimated density (number of fish per 100 m) of O. mykiss versus estimated density of pikeminnow for each sampling event at each index site in Chorro Creek, San Luis Obispo County, CA, USA, from 2017–2024. The fitted line displays the best fit relationship between O. mykiss and pikeminnow density at the average rainfall (47 cm) across all study years.
Results of this study show an overall decline in pikeminnow density within index sites sampled over the duration of the suppression program despite annual recruitment of pikeminnow in the watershed (indicated by occurrence of YOY in all years; Stillwater Sciences 2024). Data suggests O. mykiss densities respond positively within index sites following the initiation of suppression efforts and decreases in large pikeminnow following suppression efforts appear to be contributing to more favorable conditions for native O. mykiss. Suppression efforts have been effective at reducing the population of large pikeminnow within index sites, presumably reducing predation pressure on juvenile O. mykiss. However, YOY pikeminnow continue to influence rearing conditions for O. mykiss through competitive interactions, particularly following years with high rainfall.
Limitations of this study design include the relatively small number of index sites containing large pikeminnow and the potential for habitat at index sites to shift over time (e.g., from sediment movement during storms) in ways that could influence fish density irrespective of suppression efforts. Future efforts that aim to quantify the impact of suppression efforts should establish more index sites that are likely to contain large pikeminnow to increase sample size as well as “control” sites at locations where the target invasive species is not present. We also recommend collection of additional habitat metrics within index sites over time such as channel width, depth, cover types and continuous temperature to assess how habitat variables may influence study outcomes.
The results of this study suggest that suppression efforts at the current scale have conferred benefits to the O. mykiss population in Chorro Creek. While complete eradication of the pikeminnow population will likely require additional approaches and effort, the current suppression program has been aiding in the recovery and resiliency of the native O. mykiss population and is relatively low cost when compared to other suppression programs. Our research indicates that if there is another hiatus in pikeminnow suppression efforts in Chorro Creek, similar to the gap in suppression from 2010–2017, we can expect a substantial resurgence in the pikeminnow population, as evidenced by the high numbers of large pikeminnow captured in 2017 (Halligan and Otte 2011; Stillwater Sciences 2017) and by the response of YOY pikeminnow to high rainfall in spite of suppression efforts in the present study.
Recent efforts to evaluate the feasibility of implementing a Trojan Y Chromosome strategy (TYC) on pikeminnow in the Eel River in northern California, indicate this method holds potential for long-term success, although additional research is needed before field implementation (Juan and Bucheister 2025). The most viable path towards full eradication will likely require a combination of manual suppression efforts and the implementation of a TYC, as described by Lyu et al. (2020) and Juan and Bucheister (2025). In modeled simulation runs of TYC coupled with manual suppression, Juan and Bucheister (2025) found the predicted extirpation rate greatly increased when manual suppression efforts were implemented simultaneously. We are actively monitoring the progress of Eel River TYC program and remain optimistic that our ongoing control efforts in Chorro Creek will enhance the feasibility and effectiveness of a similar strategy in this watershed. Until a path toward TYC is identified, our goal is to continue to suppress the pikeminnow population annually within Chorro Creek.
Acknowledgments
This project has been funded wholly or in part by the United States Environmental Protection Agency under assistance agreements CE-98T25101 and 4T-98T47301 to the Bay Foundation of Morro Bay. The contents of this document do not necessarily reflect the views and policies of the Environmental Protection Agency (EPA), nor does the EPA endorse trade names or recommend the use of commercial products mentioned in this document. Special thanks to Stillwater Sciences staff including G. Denson, K. Fritch, A. Howe, C. Hymes, P. Michelsen, A. Poelman, C. Walton, and D. Yaconelli for assisting in suppression efforts. We are also grateful to M. Hardy (California Conservation Corps), P. Farrell (California Military Department), M. O’Connor (Morro Bay National Estuary Program), the Veterans Fisheries Corps Program, Watershed Stewards Program, and the California Conservation Corps who provided snorkel data and assisted with suppression efforts since the onset of this project. We would also like to thank M. McGoogan (National Marine Fisheries Service) for his support throughout the duration of this project.
Literature Cited
- American Veterinary Medical Association (AVMA). 2013. AVMA guidelines for the euthanasia of animals. 2013 edition. American Veterinary Medical Association, Schaumburg, IL, USA.
- Bates, D., M. Mächler, B. M. Bolker, and S. C. Walker. 2015. Fitting linear mixed-effects models using lme4. Journal of Statistical Software 67:1–48. https://doi.org/10.18637/jss.v067.i01
- Brooks, M. E., K. Kristensen, K. J. van Benthem, A. Mangusson, C. W. Berg, A. Nielsen, H. J. Skaug, M. Maechler, and B. M. Bolker. 2017. glmmTMB balances speed and flexibility among packages for zero-inflated generalized linear mixed modeling. The R Journal 9:378–400. https://doi.org/10.32614/RJ-2017-066
- Brown, L. R., and A. M. Brasher. 1995. Effect of predation by Sacramento squawfish (Ptychocheilus grandis) on habitat choice of California roach (Lavinia symmetricus) and rainbow trout (Oncorhynchus mykiss) in artificial streams. Canadian Journal of Aquatic Science 52:1639–1646. https://doi.org/10.1139/f95-758
- Brown, L. R., and P. B. Moyle. 1991. Changes in habitat and microhabitat partitioning within an assemblage of stream fishes in response to predation by Sacramento squawfish (Ptychocheilus grandis). Canadian Journal of Fisheries and Aquatic Sciences 48:849–856. https://doi.org/101139/f91-101
- Brown, L. R., and P. B. Moyle. 1997. Invading species in the Eel River, California: successes, failures, and relationships with resident species. Environmental Biology of Fishes 49:271–291. https://doi.org/10.1023/A:1007381027518
- Halligan, A., and F. Otte. 2011. Chorro Creek watershed pikeminnow removal project. Final report. Prepared by Morro Bay National Estuary Program and Hydro Terra Consulting, Morro Bay, CA, USA.
- Jarrett, K., E. Bell, E. A. Wilson, T. Dudley, and C. M. Geraghty. 2019. Using eDNA to validate predation on native Oncorhynchus mykiss by invasive Sacramento pikeminnow (Ptychocheilus grandis). California Fish and Game 105:177–187.
- Juan, A. W., and A. Bucheister. 2025. Evaluating the Trojan Y chromosome strategy for the removal of invasive Sacramento pikeminnow from the Eel River, California. North American Journal of Fisheries Management 45:1029–1047. https://doi.org/10.1093/najfmt/vqaf077
- Lyu, J., P. J. Schofield, K. M. Reaver, M. Beauregard, and R. D. Parshad. 2020. A comparison of the Trojan Y chromosome strategy to harvesting models for eradication of non-native species. Natural Resource Modeling 33(2):e12252. https://doi.org/10.1111/nrm.12252
- Nakamoto, R. J., and B. C. Harvey. 2003. Spatial, seasonal, and size-dependent variation in the diet of Sacramento pikeminnow in the Eel River, Northwestern California. California Fish and Game 89:30–45.
- National Marine Fisheries Service (NMFS). 2000. Guidelines for electrofishing waters containing salmonids listed under the Endangered Species Act. NMFS, Santa Rosa, CA, USA.
- National Marine Fisheries Service (NMFS). 2013. South-central California coast steelhead recovery plan. West Coast Region, California Coastal Area Office, Long Beach, CA, USA.
- Pollock, K. J., and M. C. Otto. 1983. Robust estimation of population size in closed animal populations from capture-recapture experiments. Biometrics 39:1035–1049.
- Stillwater Sciences. 2017. Chorro Creek pikeminnow suppression efforts. Prepared by Stillwater Sciences, Morro Bay, California for The Bay Foundation of Morro Bay, Morro Bay, CA, USA.
- Stillwater Sciences. 2024. Chorro Creek pikeminnow suppression project. Final report. Prepared by Stillwater Sciences, Morro Bay, California for The Bay Foundation of Morro Bay, Morro Bay, CA, USA.
- Thomas R. Payne & Associates (TRPA). 2001. Morro Bay tributary steelhead distribution and abundance. Final report. Prepared by Thomas R. Payne & Associates, Arcata, CA, for Coastal San Luis Resource Conservation District, Morro Bay, CA, USA.