

FULL RESEARCH ARTICLE
Sara Moriarty-Graves1†*, Erin Zulliger2†, Thomas Batter3, and Christine Found-Jackson4
1 California State Polytechnic University, Humboldt, Department of Wildlife, 1 Harpst Street, Arcata, CA 95521, USA  https://orcid.org/0000-0002-7409-2951
2 California Department of Fish and Wildlife, Shasta Valley Wildlife Area, 1724 Ball Mountain Little Shasta Road, Montague, CA 96064, USA https://orcid.org/0000-0000-9337-1035
3 California Department of Fish and Wildlife, Wildlife Branch, 1010 Riverside Parkway, West Sacramento, CA 95605, USA https://orcid.org/0000-0002-3957-3725
4 California Department of Fish and Wildlife, Northern Region, 1625 South Main Street, Yreka, CA 96097, USA
† These two authors contributed equally to this work.
*Corresponding Author: s.mgraves@outlook.com
Published 21 Nov 2023 • doi.org/10.51492/cfwj.109.10
Abstract
In northern California, Roosevelt (Cervus canadensis roosevelti) and Rocky Mountain (C. c. nelsoni) elk occupy a wide variety of habitats over a large extent, including the Marble Mountains Elk Management Unit (MM EMU). Dense forest canopy and steep, mountainous terrain present significant challenges for monitoring elk populations using traditional aerial and ground-based methods. These constraints have resulted in inadequate spatial and temporal research and monitoring. To address the need for comprehensive and reliable elk abundance estimates, we implemented a landscape-level camera trap study within the MM EMU. We deployed 180 cameras and applied a time-to-event model to estimate elk abundance. This method uses the movement rate, area in front of each camera, and leverages the latency time to detection for a given species. Analysis yielded an estimate of 1,415 (95% CI: 1,044–1,919) elk across the management unit. Here, we present the use of a recently developed method to non-invasively estimate the abundance of unmarked elk at the landscape-level in northern California. Implementation of this method can provide reliable information to aid management decisions for the continued recreational, ecological, and economic benefits of elk and wildlife in general.
Key words: abundance, California, landscape-level monitoring, non-invasive, Rocky Mountain elk, Roosevelt elk, camera traps, time-to-event, unmarked
| Citation: Moriarty-Graves, S., E. Zulliger, T. Batter, and C. Found-Jackson. 2023. Utilizing the time-to-event framework to estimate elk abundance over a large spatial scale in the Klamath Mountains of California. California Fish and Wildlife Journal 109:e10. |
| Editor: Anne Hilborn, Wildlife Branch |
| Submitted: 26 January 2023; Accepted: 10 May 2023 |
| Copyright: ©2023, Moriarty-Graves et al. This is an open access article and is considered public domain. Users have the right to read, download, copy, distribute, print, search, or link to the full texts of articles in this journal, crawl them for indexing, pass them as data to software, or use them for any other lawful purpose, provided the authors and the California Department of Fish and Wildlife are acknowledged. |
| Funding: This project is funded annually through a Pittman-Robertson grant, and the Rocky Mountain Elk Foundation funded collar purchases. |
| Competing Interests: The authors have not declared any competing interests. |
Introduction
Elk (Cervus canadensis) historically occupied most of northern California and southern Oregon (CDFW 2018). European settlement in the area caused significant declines in the late 1800s, reducing the once large range to a small area in Humboldt and Del Norte counties (Harper et al. 1967). Since the mid-20th century, elk populations in northern California have largely recovered through successful reintroductions, conservation efforts, and natural range expansions (Alison et al. 2007; CDFW 2018). Both Roosevelt elk (C. c. roosevelti) and Rocky Mountain elk (C. c. nelsoni) now discontinuously occupy a variety of habitats over a large extent including within the Marble Mountains Elk Management Unit (MM EMU). Since there is genetic evidence of hybridization between the subspecies within the MM EMU, we refer to both subspecies and hybrids as “elk” for conciseness (Meredith et al. 2007). The California Department of Fish and Wildlife (CDFW) strives to sustainably manage elk in this EMU for continued recreational use and to promote their intrinsic ecological and economic benefits. To achieve these goals, a comprehensive assessment of elk population abundance and an improved understanding of their ecology in the MM EMU is needed.
Monitoring elk in the MM EMU has historically been limited to intermittent small-scale studies with limited repetition (Table 1). From 1985–1995, 250 elk were successfully reintroduced at various locations within the EMU, and collared individuals were monitored seasonally from 1993–1994 through ground-based telemetry (Kitchen and Woodard 1996; Alison et al. 2007; CDFW 2018). In the 1990s and early 2000s, fixed wing aircraft and helicopters were used to monitor elk in this area, but dense canopy cover and low numbers of marked animals hindered reliable population estimates (Kitchen and Woodard 1996; Weckerly and Kovacs 1998). More recently, counts through cameras and visual observations in open habitats (such as agricultural and developed areas) have yielded more credible herd composition and occupancy data, although still limited to small local scales (Rocky Mountain Elk Foundation, unpublished report; E. Zulliger, CDFW, unpublished data). Furthermore, many elk in the MM EMU are remotely located, which has made elk captures difficult to achieve and thus a marked cohort problematic to maintain. Because of this, GPS collar data is inconsistent through the years and abundance estimation methods that rely on unique identifiers, such as mark-recapture methods, present significant logistical challenges.
Table 1. Elk population estimates, with 95% Confidence Intervals (CI), generated by various studies within or for the Marble Mountains Elk Management Unit (MM EMU), in northern California, USA. For comparison, study area size was included when available.
| Estimate (95% CI) | Study Area | Study Area Size | Source |
| 449 (365–559) | Somes Bar | Not reported | Tripp et al. 2022a |
| 1,415 (1,044–1,919) | MM EMU | 18,505 km2 | Present study |
| 156 (142–174) | Somes Bar | 100 km2 | CDFW; Zulliger and Moriarty-Graves2021b |
| 332 (161–1,141) | Happy Camp | 59 km2 | Kitchen and Woodard 1996 |
| 567 (NA)c | Somes Bar | Not reported | RMEF; Ford 2019d |
| 114 (NA)e | Douglas City & Trinity Center | Not reported | RMEF; Ford 2019e |
a Study area size reported as 5,584 km2 but this includes the entire Karuk Aboriginal Territory. Elk home ranges were limited to a smaller portion, but exact size is not reported.
b Internal report by California Department of Fish and Wildlife.
c Total elk count from 11 cameras in April 2018.
d Unpublished report by the Rocky Mountain Elk Foundation.
e Total elk count from 12 cameras in July 2018.
Capture and marking challenges aside, the densely forested habitat and rough terrain typically occupied by elk in this region is obstructive to aerial views of the ground (Weckerly and Kovacs 1998). Previous aerial surveys of elk have documented that both imperfect detection and under-counting occur in areas of medium to dense (>40%) canopy cover (Cogan and Diefenbach 1998; McCorquodale et al. 2013). Forest canopy cover in northern California typically exceeds this threshold prohibiting effective application of aerial surveys (Weckerly and Kovacs 1998). Resultant estimates in such consistently heavy canopy cover would result in lower precision and higher bias, necessitating application of more robust ground-based methods in this region (Batter et al. 2022a).
In recent years, alternative non-invasive methods, including fecal DNA (Henk et al. 2022; Batter et al. 2022b), and cameras (Moeller et al. 2018; IDFG 2019; Gilbert et al. 2021) have been gainfully applied to monitor elk populations and have compared favorably to traditional aerial methods. For example, a study of tule elk (C.c. nannodes) elsewhere in California compared concurrent abundance estimates from aerial surveys to those generated using fecal DNA for three populations (Batter et al. 2022a). The EMU with the highest canopy cover generated higher point count estimates using fecal DNA, which was attributed to ground access in canopied areas unobservable from the air. Fecal DNA collection and laboratory analysis can be prohibitively costly, however.
Traditionally, analysis of photos has relied on uniquely marked individuals to accurately estimate abundance through mark-recapture and spatial capture-recapture methods (Karanth 1995; Karanth and Nichols 1998; Royle et al. 2009). Because elk lack natural unique identifying characteristics, application of these methods were faced with similar constraints as aerial mark-resight due to difficulty in reliably and consistently capturing elk in this region. New analysis methods, however, have recently emerged in which encounter rates can be used to estimate abundance in unmarked populations, freeing researchers from the requirement of capturing and marking target species (Moeller et al. 2018). The time-to-event (TTE), space-to-event (STE), and instantaneous sampling (IS) models use encounter rate to estimate density, whereas higher encounter rates and reduced time between photographic events yields increasing density estimates and vice versa (Moeller et al. 2018). This method makes cameras a cost effective and safe alternative to other methods and presents a noninvasive alternative application un-reliant on a large sample size of marked individuals.
The deployment of cameras throughout the MM EMU, rather than a small subset of the region, allows for statistical methods to be used for estimating the abundance of unmarked elk populations generated at the landscape-level scale. Because elk harvest quotas are set at this scale, such a comprehensive survey is desirable to ensure sustainable tag allocation. In 2020, a pilot study with 88 cameras was conducted on a smaller spatial scale within the MM EMU (Zulliger and Moriarty-Graves 2021). The pilot study resulted in a population estimate of 156 elk (95 % CI: 142–174) within a smaller area in the MM EMU (Table 1), and we thus built off the success of the pilot study for this effort. In the summer of 2021, we deployed 180 camera traps to sample the entire MM EMU. Complimentary to this study, an occupancy modeling effort in partnership with California State Polytechnic University, Humboldt (Cal Poly Humboldt) yielded a useful subset of data that was collected to examine effects of fire on mammalian predator and ungulate occupancy. The main objective of the study presented here was to generate a robust estimate of elk abundance in forested habitats at the landscape-level scale, as part of a broader effort to establish repeatable and statistically rigorous population monitoring protocols for elk in northern California.
Methods
Study Area
The MM EMU spans 18,505 km2 which includes portions of Siskiyou, Humboldt, Trinity, Shasta, and Tehama counties in northern California (Fig. 1). It encompasses parts of the Klamath-Northern California Coastal and Sacramento watersheds (CDFW 2022). The MM EMU is within the Klamath Mountain bioregion, which is characterized by steep, complex topography with numerous large river valleys (Sugihara et al. 2006; Alison et al. 2007). This area is composed of 65% public land administered by the United States Forest Service (USFS); including the Klamath, Six Rivers, Rogue River, Shasta, and Trinity National Forests, as well as land administered by the Bureau of Land Management (BLM), and the National Park Service (NPS). Additional major land ownership includes the Hoopa Valley Tribe, large timber companies, and various private landowners at lower elevations. Aboriginal territory of the Karuk Tribe also lies within much of the EMU and the Karuk work to apply specific land management practices to benefit elk populations within this EMU (see: Connor et al. 2022; Tripp et al. 2022). Other land uses in the area include outdoor recreation, hunting, private residences, timber harvest, cattle grazing, and agriculture. Several small communities exist within the MM EMU, but there is generally a low-density human population given the high amount of public lands.
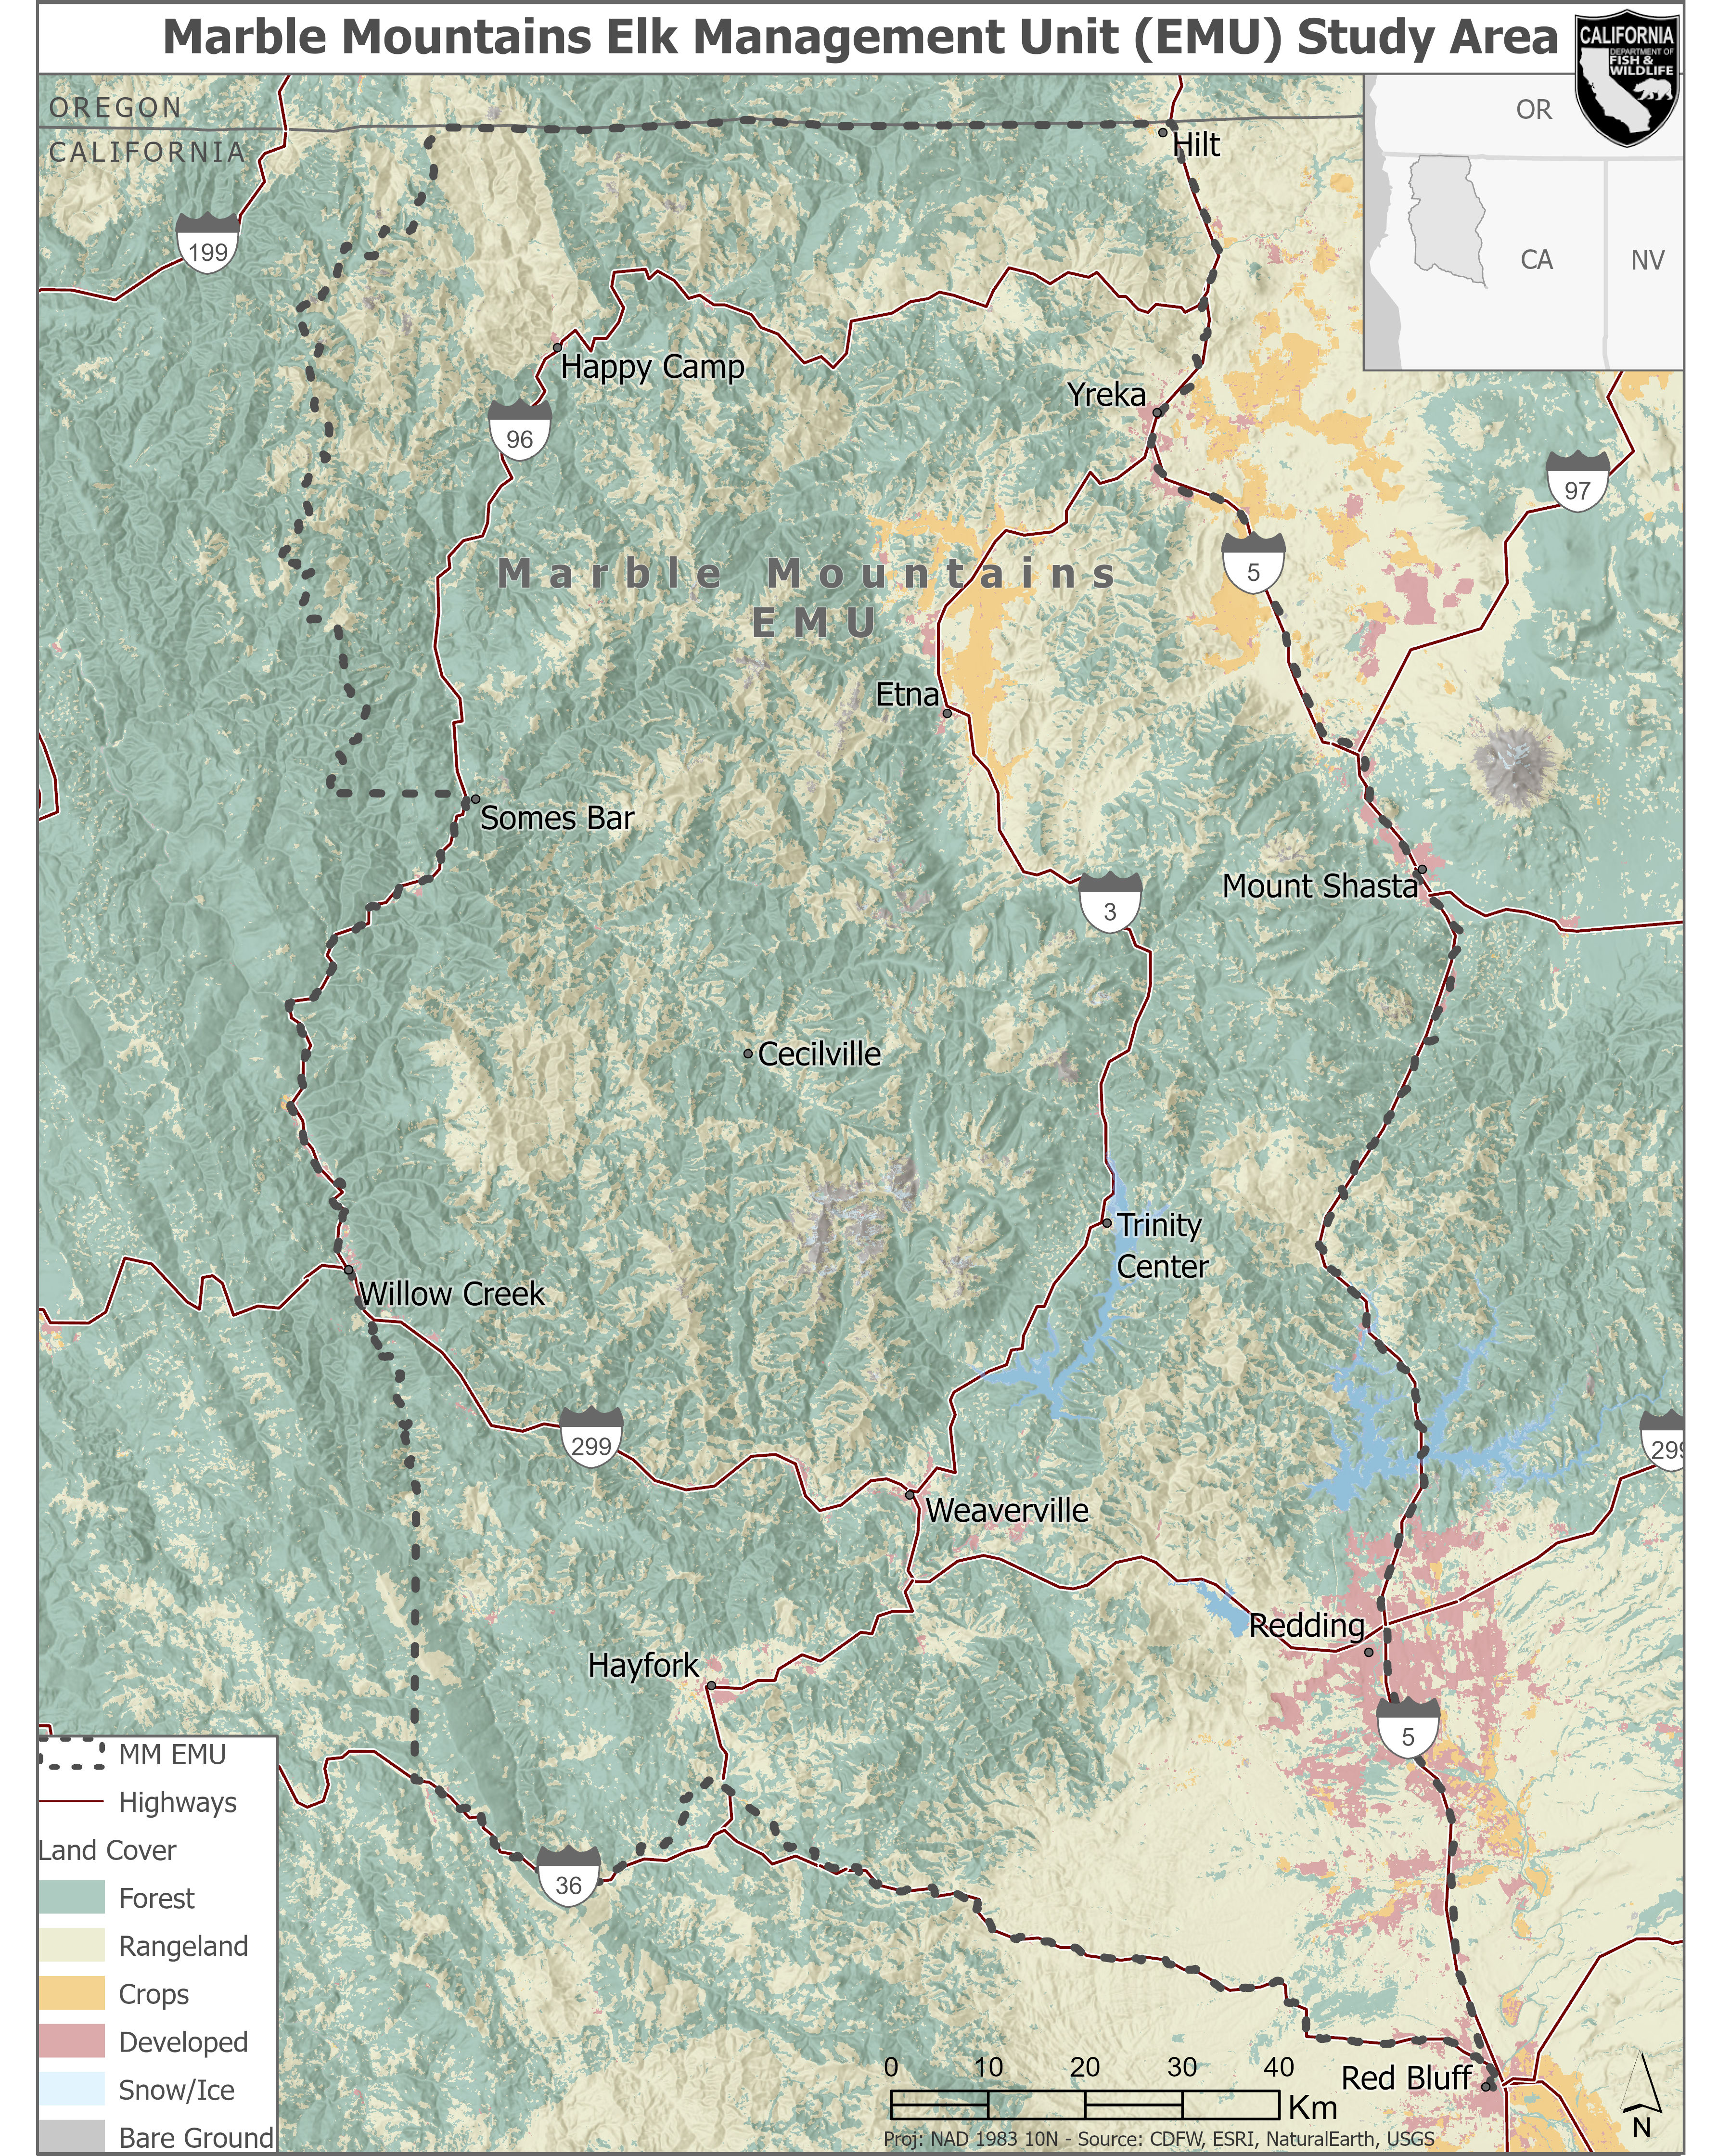
Land cover is predominately characterized as dense coniferous forest, with rangeland or shrubs, small, developed areas, and croplands (Fig. 1). Dominant tree species include Douglas-fir (Pseudotsuga menziesii), madrone (Arbutus menziesii), gray pine (Pinus sabiniana), sugar pine (Pinus lambertiana), grand fir (Abies grandis), and white fir (Abies concolor). Common shrubs include manzanita (Arctostaphylos manzanita), wedgeleaf ceanothus (Ceanothus cuneatus), and mahogany (Cercocarpus sp.). Elk summer ranges encompass high mountain meadows with lush forbs and grasses, while winter range typically occurs below 840 m in areas dominated by Douglas-fir and tanoak (Notholithocarpus densiflogrus; Alison et al. 2007). The Klamath Mountains are characterized by steep and complex topography, and the elevation in the study area ranges from 54 m to 2,751 m. Climate in the region is generally characterized as Mediterranean with wet, cool winters, and dry, warm summers, though local expression of the climate is extremely variable (Skinner et al. 2006).
In addition to elk, common mammals that occupy the study area include the American black bear (Ursus americanus), mountain lion (Puma concolor), coyote (Canis latrans), black-tailed deer (Odocoileus hemionus columbianus), and gray fox (Urocyon cinereoargenteus). Domestic cattle (Bos taurus) also periodically occur throughout the study area.
Camera Trap Site Selection
Camera stations (n = 180) were placed across the MM EMU and stratified as three types (“known”, “random”, and “fire”) to fulfill the needs of this study and a concurrent study examining the effects of fire on large mammal occupancy. Due to the heterogeneous, clustered distribution of elk, we used multiple data sources to describe known elk range to inform systematic random camera placement throughout the study area (“known” cameras, n = 112). Data used to determine known elk areas included historical observation data (Alison et al. 2007), hunter harvest data from 21 June to 22 September 2012–2019 (CDFW hunter harvest reporting 2012–2019), CDFW staff and public observation data, and summer home ranges generated from GPS collar data with a 99% kernel density estimation (KDE) method. We aggregated these occurrence data into a single spatial dataset, then generated a 5 km buffer to delineate areas eligible for systematic random sampling. Next, we used ArcMap 10.7.1 (Environmental Systems Research Institute, Inc., Redlands, California, USA) to overlay a fishnet grid composed of 25 km2 cells to guide the placement of cameras. The 25 km2 cell size was derived from the average home range sizes of herds with GPS collar data in the area (S. Moriarty-Graves, CDFW, unpublished data). Due to simple random and clustered random sampling designs potentially leading to higher variance in detection probabilities and the clustered distribution of elk across the study area, most cameras (n = 112) were stratified into this systematic random fashion (Wearn and Glover-Kapfer 2017).
Using the same 25 km2 grid, we randomly selected cells for 38 cameras (“random” cameras) using ArcMap 10.7.1 (Environmental Systems Research Institute, Inc., Redlands, California, USA). These random locations were at least 5 km from any other camera and were deployed to increase the coverage of areas outside of where elk have been known to occur. Finally, in collaboration with Cal Poly Humboldt, 30 additional cameras were deployed in previous burn scars (“fire” cameras). These cameras were systematically placed to sample fire severity and time since fire in areas impacted by wildfires up to 15 years ago but were also selected using pre-determined locations that were at least 5 km apart from any other camera site. These cameras additionally increased the coverage of areas outside of known elk areas.
Camera Deployment
After a pre-determined cell was selected, we only allowed cameras to be placed within 1 km of the cell’s center point and when possible, the field of view was angled towards animal trails or open areas to maximize detections and to limit false triggers (Furnas et al. 2020; Gaynor et al. 2020; Nickel et al. 2020). When placement within 1 km of the predetermined point was not possible, an alternative location at least 5 km from another camera was randomly chosen. Cameras were placed within 2 km from a road or trail to assist with placement in steep and densely forested terrain but were at least 100 m away from a main road and or recreational trail to avoid human interference and to adhere to access agreements with the USFS. When possible, cameras were placed facing north to avoid false detections caused by direct sunlight and directed towards open areas to avoid false trigger detections caused by vegetation (Gaynor et al. 2020). Cameras were placed approximately 1 m off the ground and secured to trees. Cameras were programmed to take three photos per trigger detection with a 1-minute delay between activations (Wang et al. 2015; Nickel et al. 2020).
We deployed cameras from 27 May to 24 June 2021 and retrieved them beginning on 2 August 2021. Due to fire and winter weather conditions, the last camera was retrieved the following year on 12 July 2022. Sites were accessed by vehicle, hiking, and backpacking. We stored and processed photos within the cloud-based platform Wildlife Insights (www.wildlifeinsights.org).
Statistical Analyses
We applied the TTE method to estimate elk abundance (Moeller et al. 2018). This method leverages the latency time to detection for a given species of interest to estimate abundance. The model requires independent estimates of animal movement rate and the area in front of the camera. It assumes demographic and geographic closure of the study area, random or systematic camera placement, and independent observations of animals (Moeller et al. 2018; Moeller and Lukacs 2022).
To account for the assumptions of the model, cameras were spaced far enough apart to retain independence of detections. We additionally discarded calf detections from the data frame and the sampling season was truncated prior to hunting season (beginning in the MM EMU on the Wednesday preceding the second Saturday in September each year; California Code of Regulations, Title 14, § 364(r)(3)(A)(5)) to adhere to the assumption of population closure. The placement of cameras themselves did not target certain features, and therefore, did not violate assumptions of random placement (Moeller et al. 2018). Additionally, cameras were not baited with attractants. We only used data from the first full day and last full day of deployment to define the start and end dates for our sampling period. Cameras that collected less than seven days of data were removed. If a fire entered the frame or the camera was significantly tilted towards the ground and the frame was obscured, the following photos were discarded from analysis.
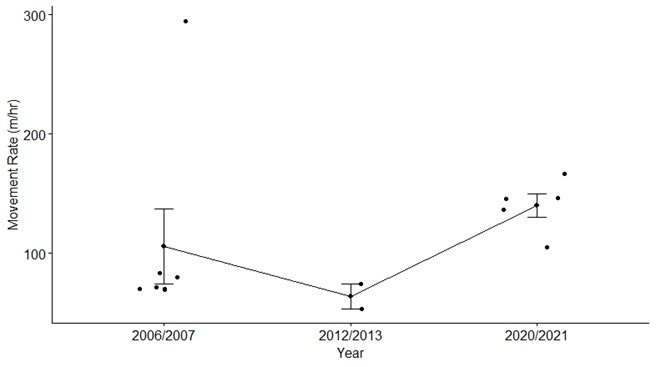
The summer movement rate was calculated from 14 elk (11 females, 3 males) that were previously collared within the MM EMU from 2006–2007, 2012–2013, 2020, and 2021 with the ‘move’ package in RStudio (R Development Core Team 2022; Smolla et al. 2022; Fig. 2). When collar data was available over multiple years for the same herd, we used the more recent data. Data from 1 June to 15 August for each year included was used to generate the movement rate. To determine if movement rate was significantly different by herd, year, or sex, we used a one-way ANOVA. Sex and herd were categorized accordingly but since sample size was small per year, we grouped periods of years together (e.g., 2006/2007) before running the analysis.
The area for each camera was based on the visible, unobstructed distance in front of the camera and a field of view of 43.5 degrees. The field of view is the weighted mean of the four Browning camera models (SpecOps, DarkOps, Dark Ops Max HD, and StrikeForce Apex, Browning Trail Cameras, Birmingham, Alabama, USA) used in the analysis. Because we are interested in providing inference about elk within the current hunt unit boundaries (which conform to the MM EMU boundaries), we used the boundaries of the MM EMU to define our study area. Therefore, the study area size was 18,505 km2.
The TTE analysis was conducted with the ‘spaceNtime’ package in RStudio (R Development Core Team 2022; Moeller and Lukacs 2022). Additionally, the sampling occasions and period lengths were built with this package. An occasion was defined as one full day (24 hours), with 194 periods per occasion. The number of periods per occasion was determined by the movement speed of elk and the viewshed area in front of cameras (Moeller and Lukacs 2022). Specifically, the period length was determined to be 436.25 seconds based on the movement rate, and there are 194 periods of that length within the number of seconds within one day (84,600).
Results
We deployed a total of 180 cameras across the MM EMU. We excluded cameras from our analysis that were destroyed by fire (n = 14), cameras that were significantly altered or experienced a hardware malfunction (n = 15), and cameras that were incorrectly deployed (n = 5). We included 143 cameras in our analysis with the sampling period defined as 7 June through 15 August 2021. These cameras yielded a total of 8,098 camera trapping days, with an average of 57 days per camera.
All cameras retrieved from the field cumulatively collected over 575,000 photos, with 22,566 animal detections (Table 2). Photos of humans and domestic dogs were excluded. Other detections included vegetation and other false triggers. The major wildlife species detected on our cameras included black-tailed deer (55.6%), squirrels and chipmunks (12.2%), American black bear (8.9%), elk (3.7%), cattle (3.1%), and various bird species (2.9%).
Table 2. Species detected at camera sites deployed in the Marble Mountains Elk Management Unit (EMU) in northern California, USA. Cameras were deployed from 27 May to 24 July 2021 and retrieval occurred from 2 August to 12 July 2022. Species are ranked by the number of photos. The table excludes photos of humans and domestic dogs.
| Scientific Name | Common Name | Number of Photos |
| Odocoileus hemionus | Black-tailed deer | 12,540 |
| Sciuridae family | Squirrel and chipmunk | 2,749 |
| Ursus americanus | American black bear | 2,002 |
| Cervus canadensis | Elk | 846 |
| Bos taurus | Cattle | 709 |
| Unspecified bird spp. | Bird | 648 |
| Leporidae family | Rabbit | 395 |
| Equus caballus | Horse | 311 |
| Urocyon cinereoargenteus | Gray fox | 212 |
| Canis latrans | Coyote | 108 |
| Puma concolor | Mountain lion | 74 |
| Pekania pennanti | Fisher | 56 |
| Mephitis mephitis | Skunk | 36 |
| Lynx rufus | Bobcat | 35 |
| Muridae family | Rodent | 12 |
| Bassariscus astutus | Ringtail | 11 |
| Martes caurina | Pacific marten | 3 |
| Procyon lotor | Racoon | 2 |
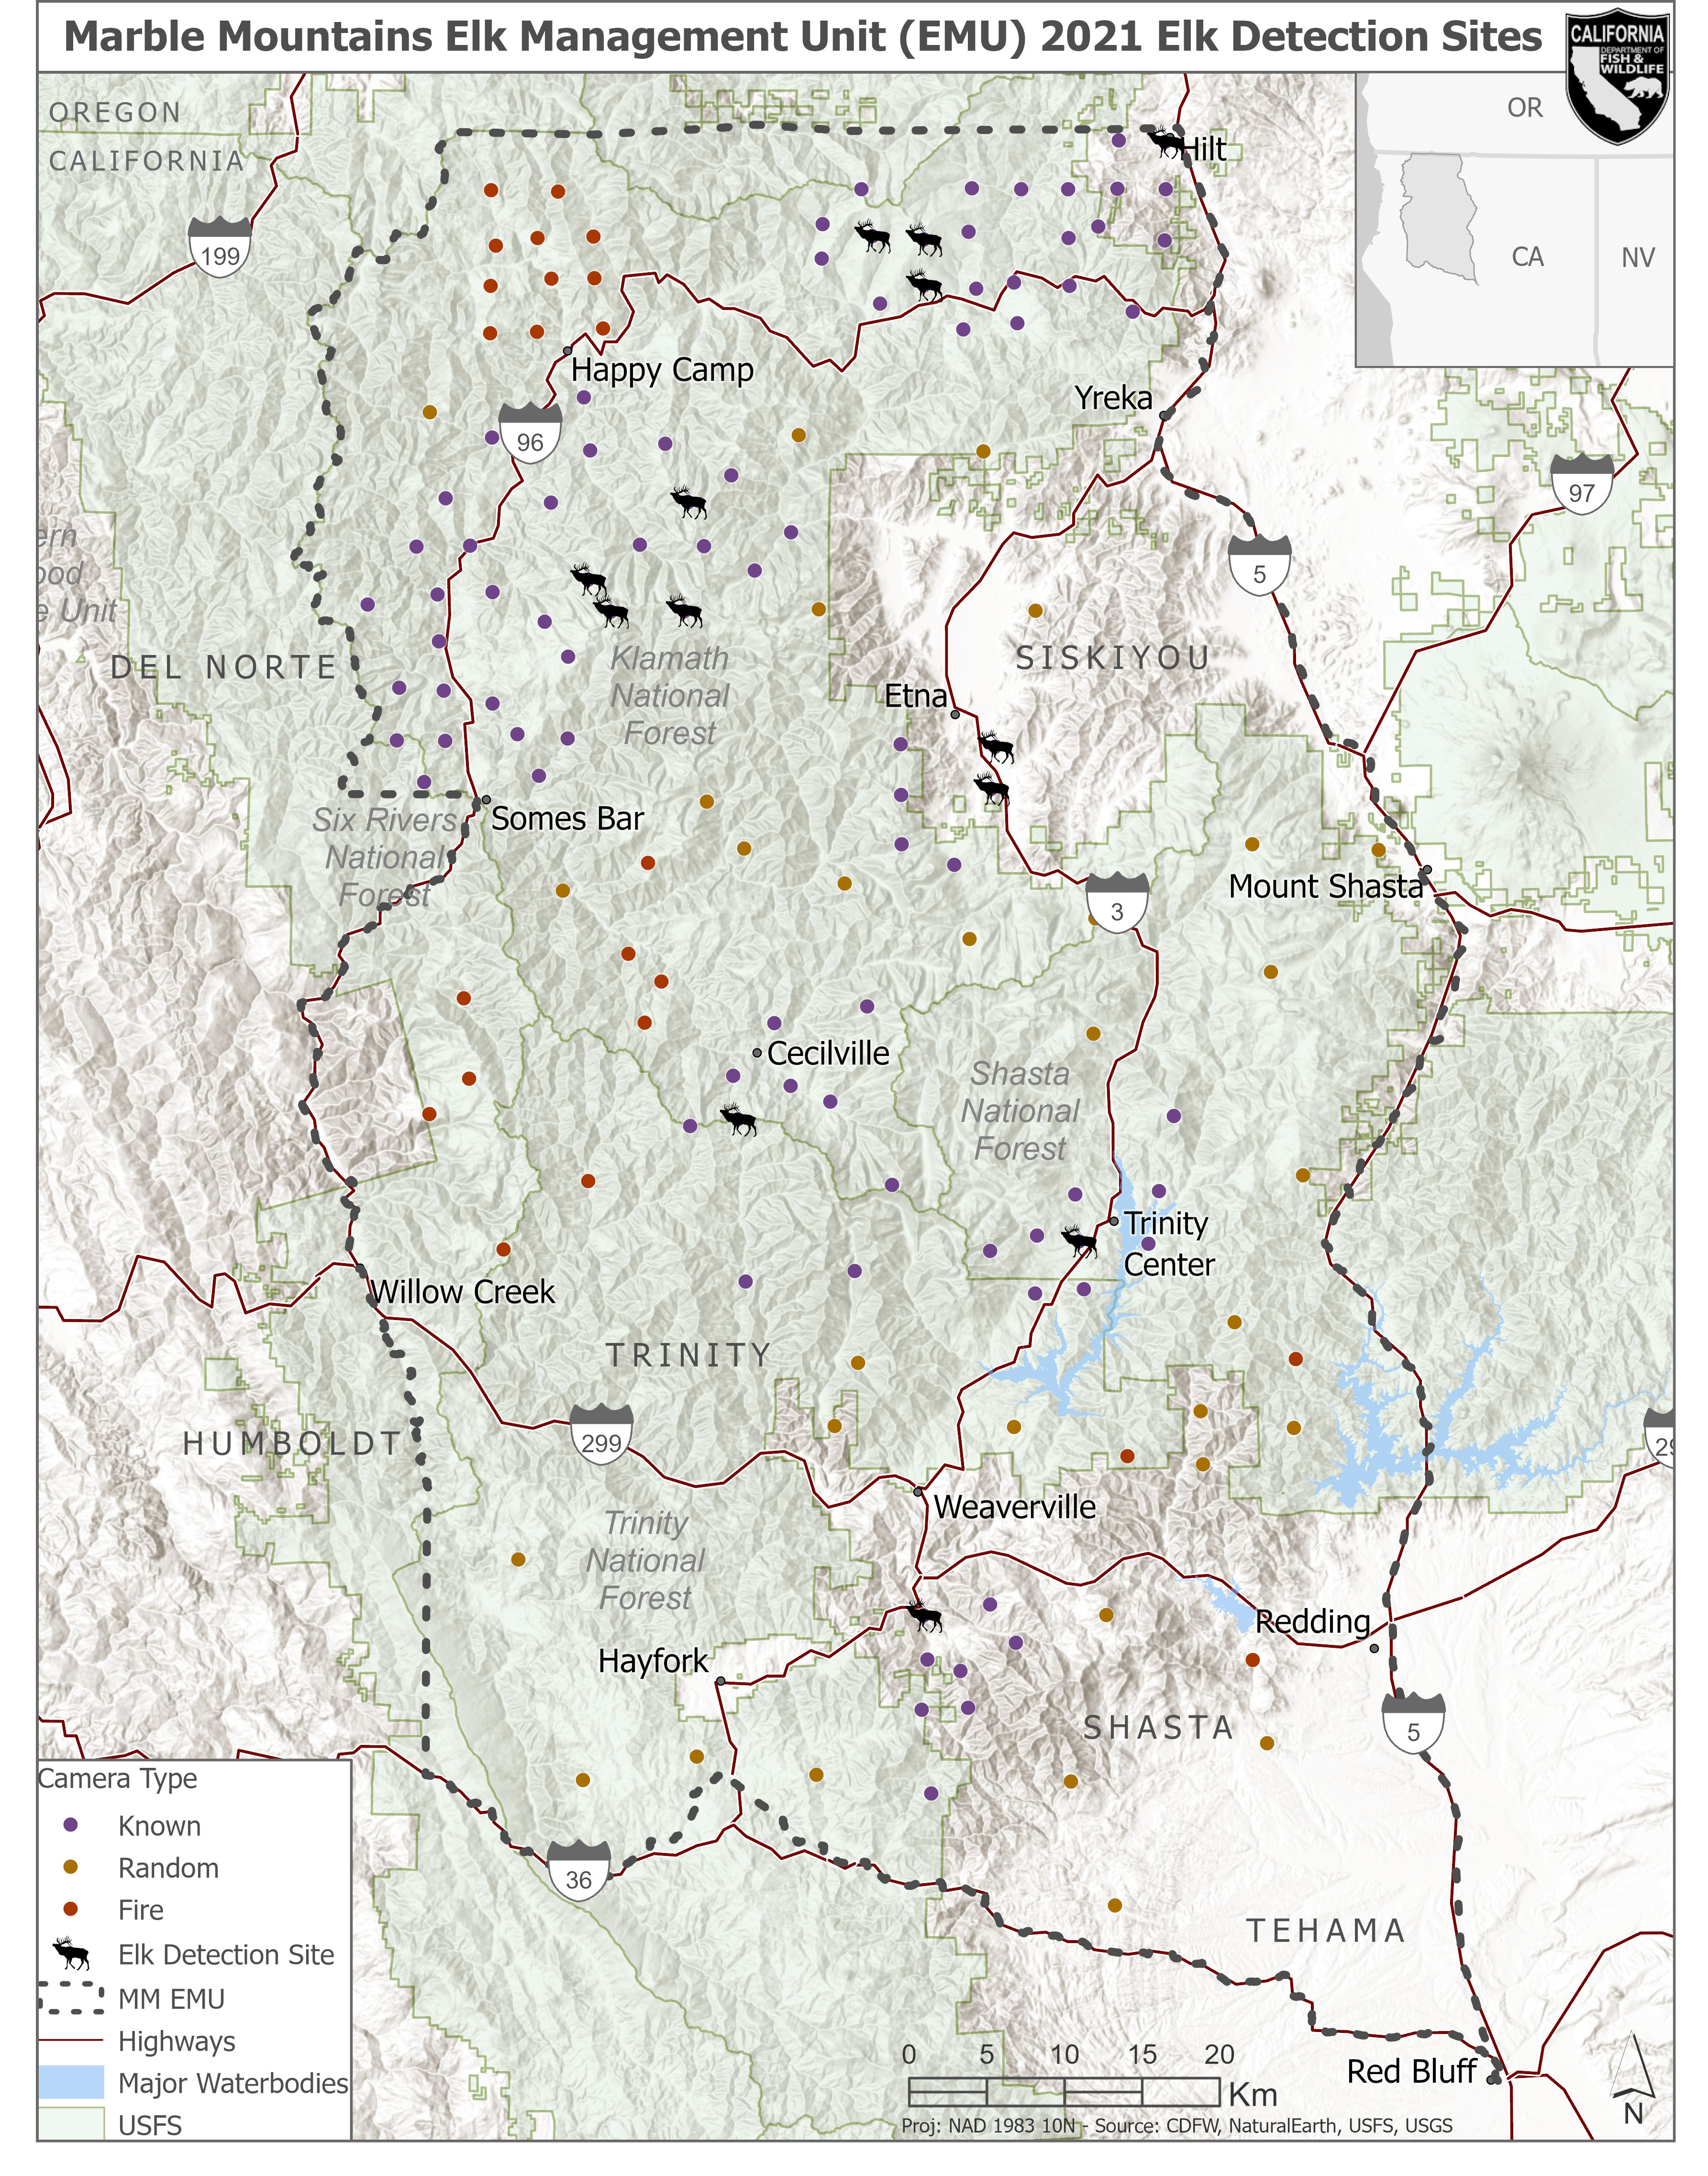
Of the 143 viable camera sites, 13 camera sites (11%) detected elk (Fig. 3). There was at least one detection within each known herd areas; Hilt (n = 1), Horse Creek (n = 3), Somes Bar (n = 4), Scott Valley (n = 2), Cecilville (n = 1), Trinity Center (n = 1), and Douglas City (n = 1). All camera sites that detected elk occurred in known herd areas, and no random (n = 31) or fire cameras (n = 23) detected elk.
We calculated movement rate from 8,663 fix locations on 14 collared individuals and compared rates across herd, sex, and year (11 adult females, 3 adult males; Fig. 2). The movement rate ranged from 53 m/hour to 295 m/hour but was not significantly different by herd (F3,10 = 0.81, P = 0.52), sex (F1,12 = 0.02, P =0.89), or year (F2,11 = 1.1, P = 0.37; Fig. 2). Therefore, we used the average movement rate inclusive of herd, sex, and year (112 m/hour) in the TTE analysis. The TTE analysis resulted in an estimate of 1,415 elk (95% CI: 1,044–1,919) throughout the MM EMU.
Discussion
Traditionally, abundance estimation with the use of cameras has largely relied on marked individuals and mark-recapture methods to obtain accurate counts. Although proven to be precise and accurate, application of these methods requires a large up-front cost investment in equipment and staff time to mark individuals, and maintenance of a sufficiently marked cohort can be challenging. Time-to-event models reduce the reliance on intensive collaring efforts and represent alternative methods to provide reliable estimates. The initial results from this study represent improvement towards monitoring elk in environments that are not conducive to direct observation. Our results suggest that utilizing the TTE model was successful, despite logistical constraints and unforeseen difficulties that resulted in a reduced sample size of active cameras. Additionally, our results represent an unprecedented attempt to survey elk across a large spatial scale in this area.
Before this effort, there has been limited data collected on elk in this area and it was often limited to the herd level (Table 1). The Karuk Tribe, for instance, successfully used cameras and fecal DNA methods to estimate elk population size and composition, but these data are limited to a single population occupying a small portion of the hunt zone (Tripp et al. 2022). Because of this, it is difficult to compare our results to other similar studies but the confidence interval around our estimate suggests a reasonable estimate to aid in future management decisions.
Our results suggest that elk distribution across the MM EMU mirrors “known” elk locations. We placed a total of 112 cameras in “known” elk locations by integrating data from a variety of sources and successfully detected at least one elk detection in each of these areas but did not detect elk on cameras placed in other areas across the study region. This suggests that our estimate accounts for elk in main herd areas throughout the MM EMU, and that the 95% confidence interval (1,044 to 1,919) did not over or underestimate elk. However, since data from 37 cameras was not available to include in the analysis, we believe the upper limit for the estimate (1,919) is more reasonable to accept than the lower limit (1,044). The fact that cameras detected elk only in known herd areas should be considered in sampling designs for species with clumped distribution. These location data further key into areas to concentrate efforts for collaring and other survey efforts that may occur in the future.
Through this study, we obtained new and more recent elk location data in this understudied MM EMU in northern California. Prior to 2019, data has been limited to only public observations and reported hunter harvest locations for the past 15 years. For instance, GPS collar data for the Cecilville herd is only available from 2006–2007, aerial telemetry data on the Trinity Center herd is only available from 2000–2002, and data for other herds within the study area is generally limited. Interestingly, we detected elk in the northeastern section of the Marble Mountain Wilderness Area (MMWA). Other than hunter harvest locations, there is no CDFW data available for elk in this area, potentially indicating group splitting or range expansion from established herds in the south and west of the MMWA. Additionally, there has been limited recent data collected (hunter harvest, public observations, or both) on herds in the Horse Creek, Cecilville, Trinity Center, and Douglas City areas, which all had elk detections on cameras.
The TTE model assumes demographic closure, meaning that there is no death, birth, emigration, or immigration within the sampling period. Due to limited road access in the fall, winter, and early spring and critical fire weather in the late summer and fall, we chose to implement this study in the late spring to mid-summer. We realize that the sampling period is within the peak calving period for elk (Nigon 2020), which violates the assumption of population closure. We attempted to account for this violation by excluding calf detections from the detection history used for analysis. In addition, the sampling season was truncated prior to the start of the hunting season to further adhere to this assumption. Despite these precautions, previous literature suggests that violating the population closure assumption has no adverse effect on time-to-event abundance estimates (Loonam 2019) and it may have been unnecessary to limit our sampling period in this way.
Inversely, our sampling period may have served to offset the violation of the TTE model assumption of independent detections. During the calving season, there is a general trend of reduced social cohesion of female groups (Jenkins and Starkey 1982; Weckerly 1999). Following this time, social cohesion increases as calves become more resilient, and even more so when the rutting season begins (Bowyer 1981, 2004). Due to seasonal changes of grouping behavior, elk would be the most likely to occur more independently of one another during our sampling period (7 June to 15 August 2021). The assumption of independence is interpreted as animals at one camera are not any more or less likely to be detected at the next camera (Moeller et al. 2018). One study demonstrated that male tule elk space use tended to be independent while female tule elk space use was dependent during a similar sampling period in California’s interior Coastal Range (Batter et al. 2022a); inclusion of both male and female detections in abundance estimation was sufficient to offset biases resulting from female aggregation. Although that analysis used fecal DNA in a spatial capture-recapture context, we suspect that inclusion of both sexes in our analyses produced similar effects due to the shared life history traits across elk subspecies (Geist 2002; CDFW 2018). The assumption of independent detections may not fully be adhered to with social grouping animals, but the seasonality of this study may have also reduced the effects of this assumption violation.
The further spacing of cameras at least 5 km apart and the fact that the placement of camera grids did not target certain features also adheres to the assumption of independence. The sampling occasion of one day was also chosen to support independence of detections. Specifically, it would take an elk 35 hours to walk 4 km based on our elk movement rate of 112 m per hour. This would allow elk more time than a single occasion to redistribute across the landscape, with the intention of increasing independence and potentially reducing autocorrelation across observations (Moeller et al. 2018).
With this in mind, we encourage wildlife managers to consider the assumptions and logistical constraints when implementing this TTE method. This method can be particularly useful in rugged and densely forested terrain, such as the MM EMU, where other methods such as aerial flights are not feasible or efficient. However, the use of cameras over a large area does not come without logistical constraints. For instance, over 15 CDFW staff, three USFS staff, and three volunteers were involved in the deployment and retrieval of cameras. Additionally, the efforts to manage large amounts of camera data and process a large quantity of photos can be time-intensive. New software has been developed since the start of this project and continues to improve photo processing time, but we found it was not completely efficient to use the software available to us for this analysis and still relied heavily on manual photo processing.
Other studies have demonstrated promising results for abundance estimation by employing a hybrid approach that combines the advantages of cameras with other techniques such as fecal DNA (Furnas et al. 2020; Tripp et al. 2022). In addition to obtaining accurate abundance estimates, these studies have shown the added benefit of gathering valuable information about age and sex composition and genetic connectivity. Given the intense effort that this EMU requires to monitor remote populations, future efforts should combine approaches or develop systems to easily collaborate with others on similar projects.
Finally, the TTE method still relies on accessory data from collars to estimate movement rates and it is unclear if using older collar data would skew the results of future studies. This may become especially important as animals change their movements in relation to changing environmental conditions (i.e., increased fire activity or climate change). In the absence of movement rates, the STE and IS models are good alternatives, but require proper planning before deployment and using these models may result in reduced precision of estimates (Moeller et al. 2018; Loonam et al. 2020). We recommend budgeting for these extra needs and taking advantage of technological aids like species-recognition software in future studies.
Acknowledgments
We would like to thank all the Scientific Aides that assisted with fieldwork: A. Vakili, G. Olson, N. McHugh, A. Kinberg, S. Stromer, A. Harper, A. Reeder, M. Henk, and all the fisheries Scientific Aides that assisted. Thanks also goes to the Environmental Scientists C. Hilson and M. Hunnicutt, J. Garwood, and K. Morefield for help with field coordination. We thank all our volunteers and interns: K. Johnson, D. Aceves, E. Crockett, M. Lehman, H. Perez, T. Barton, and P. Garrett, and the USFS staff, D. Ollinger for assisting with retrieving cameras and coordinating fire crews to retrieve cameras in areas with an active wildfire. We also thank M. Szykman-Gunther, A. Moeller, B. Furnas, and L. Rich for various logistical or technical support, and the Cal Poly Humboldt Wildlife Department for providing supplemental cameras and supplies. We would also like to thank R. Schaefer (California Department of Fish and Wildlife, retired), whose previous work provided the historic collar data that was critical in our analysis. We would also like to thank E. Tripp and the Karuk Tribe for collaborating with us on this project and sharing collar data from their recent efforts. This project is funded annually through a Pittman-Robertson grant, and lastly, we thank the Rocky Mountain Elk Foundation for funding collar purchases that benefitted this project.
Literature Cited
- Alison, B. L., M. R. Creasy, M. K. Ford, A. Hacking, R. Schaefer, J. R. West, and Q. Youngblood. 2007. Elk management strategy: Klamath National Forest. U.S. Forest Service, Klamath National Forest, Happy Camp, CA, USA.
- Batter, T. J., R. H. Landers, K. Denryter, and J. P. Bush. 2022a. Use of aerial distance sampling to estimate abundance of tule elk across a gradient of canopy cover and comparison to a concurrent fecal DNA spatial capture-recapture survey. California Fish and Wildlife Journal 108:129–157.
- Batter, T. J., J. P. Bush, and B. N. Sacks. 2022b. Robustness of fecal DNA spatial capture-recapture to clustered space-use by tule elk. Journal of Wildlife Management 86 (7):e22290. https://doi.org/10.1002/jwmg.22290
- Bowyer, T. R. 1981. Activity, movement, and distribution of Roosevelt elk during rut. Journal of Mammalogy 62:574–582. https://doi.org/10.2307/1380404
- Bowyer, T. R. 2004. Sexual segregation in ruminants: definitions, hypothesis, and implications for conservations and management. Journal of Mammalogy 85:1039–1052. https://doi.org/10.1644/BBL-002.1
- California Department of Fish and Wildlife (CDFW). 2018. Elk Conservation and Management Plan. California Department of Fish and Wildlife, Wildlife Branch, Sacramento, CA, USA.
- California Department of Fish and Wildlife (CDFW). 2022. Biographic Information and Observation System (BIOS). California Department of Fish and Wildlife, Biogeographic Data Branch, Sacramento, CA, USA.
- Cogan, R. D., and D. R. Diefenbach. 1998. Effect of undercounting and model selection on sightability-adjustment estimator for elk. Journal of Wildlife Management 62:269–279. https://doi.org/10.2307/3802288
- Connor, T., E. Tripp, B. Tripp, B. J. Saxon, J. Camarena, A. Donahue, D. Sarna-Wojcicki, L. Macaulay, T. Bean, A. Hanbury-Brown, and J. Brashares. 2022. Karuk ecological fire management practices promote elk habitat in northern California. Journal of Applied Ecology 59:1874–1883. https://doi.org/10.1111/1365-2664.14194
- Furnas, B. J., R. H. Landers, R. G. Paiste, and B. N. Sacks. 2020. Overabundance of black-tailed deer in urbanized coastal California. Journal of Wildlife Management 84:979–988. https://doi.org/10.1002/jwmg.21849
- Gaynor, K. M., J. H. Daskin, L. N. Rich, and J. S. Brashares. 2020. Postwar wildlife recovery in an African savanna: evaluating patterns and drivers of species occupancy and richness. Animal Conservation 24:510–522. https://doi.org/10.1111/acv.12661
- Geist, V. 2002. Adaptive behavioral strategies. Pages 389–433 in D. E. Toweill and J. W. Thomas, editors. North American Elk: Ecology and Management. Smithsonian Institution Press, Washington, D.C., USA.
- Gilbert, N. A., J. Clare, J. Stenglein, and B. Zuckerberg. 2021. Abundance estimation of unmarked animals based on camera trap data. Conservation Biology 35:88–100. https://doi.org/10.1111/cobi.13517
- Harper, J. A., J. H. Harn, W. W. Bentley, and C. F. Yocom. 1967. The status and ecology of the Roosevelt elk in California. Wildlife Monographs 16:3–49.
- Henk, M., C. Hilson, W. T. Bean, D. Barton, and M. Szykman Gunther. 2022. Noninvasive genetic sampling with a spatial capture-recapture analysis to estimate abundance of Roosevelt elk. Journal of Wildlife Management 86:1–14. https://doi.org/10.1002/jwmg.22294
- Idaho Department of Fish and Game (IDFG). 2019. Evaluation of camera-based occupancy modeling for estimating ungulate abundance. A final report to the Idaho Department of Fish and Game, Boise, ID, USA. Available from: https://collaboration.idfg.idaho.gov/WildlifeTechnicalReports/Forms/AllItems.aspx
- Jenkins, K. J., and E. E. Starkey. 1982. Social organization of Roosevelt elk in an old-growth forest. Journal of Mammalogy 63:331–334. https://doi.org/10.2307/1380651
- Karanth, K. U. 1995. Estimating tiger Panthera tigris populations from camera-trap data using capture-recapture models. Biological Conservation 71:333–338. https://doi.org/10.1016/0006-3207(94)00057-W
- Karanth, K. U., and J. D. Nichols. 1998. Estimation of tiger densities in India using photographic captures and recaptures. Ecology 79:2852–2862. https://doi.org/10.1890/0012-9658(1998)079[2852:EOTDII]2.0.CO;2
- Kitchen, D. W., and P. M. Woodard. 1996. Seasonal habitat use and herd composition by Roosevelt elk in the Marble Mountains, Siskiyou County, California. Administrative report submitted to California Department of Fish and Game. Sacramento, CA, USA.
- Loonam, K. E. 2019. Assessing the robustness of time-to-event abundance estimation. Thesis, University of Montana, Missoula, MT, USA.
- Loonam, K. E., D. E. Ausband, P. M. Lukacs, M. S. Mitchell, and H. S. Robinson. 2021. Estimating abundance of an unmarked, low-density species using cameras. Journal of Wildlife Management 85:87–96.
- McCorquodale, S. M., S. M. Knapp, M. A. Davison, J. S. Bohannon, C. D. Danilson, and W. C. Madsen. 2013. Mark-resight and sightability modeling of a western Washington elk population. Journal of Wildlife Management 77: 359–371. https://doi.org/10.1002/jwmg.451
- Meredith, E. P., J. A. Rodzen, J. D. Banks, R. Schaefer, H. B. Ernest, T. R. Famula, and B. P. May. 2007. Microsatellite analysis of three subspecies of elk (Cervus elaphus) in California. Journal of Mammalogy 88:801–808. https://doi.org/10.1644/06-MAMM-A-014R.1
- Moeller, A. K., P. M. Lukacs, and J. Horne. 2018. Three novel methods to estimate abundance of unmarked animals using remote cameras. Ecosphere 9:1–15. https://doi.org/10.1002/ecs2.2331
- Moeller, A., and P. M. Lukacs. 2022. spaceNtime: an R package for estimating abundance of unmarked animals using camera-trap photographs. Mammalian Biology 102:581–590. https://doi.org/10.1007/s42991-021-00181-8
- Nickel, B. A., J. P. Suraci, M. L. Allen, and C. C. Wilmers. 2020. Human presence and human footprint have non-equivalent effects on wildlife spatiotemporal habitat use. Biological Conservation 241:1–11. https://doi.org/10.1016/j.biocon.2019.108383
- Nigon, E. 2020. Estimates of calf survival and factors influencing Roosevelt elk mortality in northwestern California. Thesis, Humboldt State University, Arcata, CA, USA.
- R Development Core Team. 2022. R: A language and environment for statistical computing. R Foundation for Statistical Computing, Vienna, Austria. Available from: <http://www.Rproject.org/>
- Royle, J. A., K. U. Karanth, A. M. Gopalaswamy, and N. S. Kumar. 2009. Bayesian inference in camera trapping studies for a class of spatial capture-recapture models. Ecology 90:3233–3244. https://doi.org/10.1890/08-1481.1
- Skinner, C. N., A. H. Taylor, and J. K. Agee. 2006. Klamath Mountains bioregion. Pages 170–194 inN. G. Sugihara, J. W. Van Wagtendonk, S. L. Stephens, A. E. Thode, K. E. Shaffer, and J. Fites-Kaufman, editors.Fire in California’s Ecosystems. University of California Press, Oakland, CA, USA.
- Smolla, M., B. Kranstauber, and A. Scharf. 2022. Move: visualizing and analyzing animal track data. Available from: https://CRAN.R-project.org/package=move
- Sugihara, N. G., T. Keeler-Wolf, and M. G. Barbour. 2006. Fire and California vegetation. Pages 1–8 inN. G. Sugihara, J. W. Van Wagtendonk, S. L. Stephens, A. E. Thode, K. E. Shaffer, and J. Fites-Kaufman, editors.Fire in California’s Ecosystems. University of California Press, Oakland, CA, USA.
- Tripp, E., T. Connor, B. J. Saxon, J. Camarena, D. Sarna-Wojcicki, L. Macaulay and J. Brashares. 2022. Marble Mountain elk ecology and management collaborative research initiative. A final project report to the California Department of Fish and Wildlife, Wildlife Branch, Sacramento, CA, USA.
- Wang, Y., M. L. Allen, and C. C. Wilmers. 2015. Mesopredator spatial and temporal responses to large predators and human development in the Santa Cruz Mountains of California. Biological Conservation 190:23–33. https://doi.org/10.1016/j.biocon.2015.05.007
- Wearn, O. R., and P. Glover-Kapfer. 2017. Camera-trapping for conservation: a guide to best-practices. World Wildlife Fund Conservation Technology Series, Woking, UK.
- Weckerly, F. W., and K. E. Kovacs. 1998. Use of military helicopters to survey an elk population in North Coastal California. California Fish and Game 84:44–47.
- Weckerly, F. W. 1999. Social bonding and aggression in female Roosevelt elk. Canadian Journal of Zoology 77:1379–1384. https://doi.org/10.1139/z99-101
- Zulliger, E., and S. Moriarty-Graves. 2021. Investigating abundance and demography of elk populations in northern California—evaluating remote camera methods for monitoring in forested habitats. California Department of Fish and Wildlife, Wildlife Branch, Sacramento, CA, USA.