

FULL RESEARCH ARTICLE
Vanessa M. Gusman Costa and Colby L. Hause
California Department of Fish and Wildlife, Fisheries Branch, 1010 Riverside Parkway, West Sacramento, CA 95605, USA
 https://orcid.org/0000-0002-4451-7488 (VMGS)
https://orcid.org/0000-0001-7355-028X (CLH)
*Corresponding Author: vanessa.gusman@wildlife.ca.gov
Published 21 Nov 2023 • doi.org/10.51492/cfwj.109.11
Abstract
Angler demographics and behaviors have a significant impact on recreational fishery-dependent data, and recently, human dimensions have become more widely recognized as an important part of fisheries management. California’s steelhead (Oncorhynchus mykiss) report card program has served to track recreational fishing effort and catch each calendar year for management purposes through angler self-reporting. However, angler report card return rates are consistently low, and there has been no recent effort to investigate angler attributes that may be contributing to nonresponse. This study evaluated trends in angler demographics as they relate to annual steelhead report card return rates as well as online reporting rates across the 2012–2019 study period. The study also assessed whether specific demographic or behavioral characteristics may affect the likelihood of anglers returning their report cards. Older, more avid anglers were found to have a greater likelihood of reporting in general. Motivations or deterrents for response vs. nonresponse could not be identified due to data limitations and should be the subject of future research.
Key words: angling avidity, angler reporting, angler survey, catch card, human dimensions, nonresponse bias, nonresponse error
| Citation: Gusman Costa, V. M., and C. L. Hause. 2023. Human dimensions of angler nonresponse in California’s recreational steelhead fishing report card program. California Fish and Wildlife Journal 109:e11. |
| Editor: Erica Meyers, Water Branch |
| Submitted: 5 July 2022; Accepted: 18 October 2022 |
| Copyright: ©2023, Gusman Costa and Hause. This is an open access article and is considered public domain. Users have the right to read, download, copy, distribute, print, search, or link to the full texts of articles in this journal, crawl them for indexing, pass them as data to software, or use them for any other lawful purpose, provided the authors and the California Department of Fish and Wildlife are acknowledged. |
| Competing Interests: The authors have not declared any competing interests. |
Introduction
Natural resource management is heavily dependent on working with the public, and it is important to understand the human dimensions of fisheries beyond just documenting catch and effort (Ditton and Hunt 2001). Investigating human dimensions in recreational fisheries management has become a topic of more recent interest and importance to managers (Wilde et al. 1996; Hunt et al. 2013; Gundelund et al. 2020; Midway et al. 2020; Koemle et al. 2021), including the study of angler socio-demographic attributes, avidity, trends in fishery participation, opinions on management practices, and fishing enjoyment (Ditton and Hunt 2001). Statewide or regional angler surveys are an effective and commonly used way to collect this information (Wilde et al. 1996; Ditton and Hunt 2001).
There are two primary survey types for collecting information on recreational fishing activity: on-site and off-site surveys (Pollock et al. 1994). On-site surveys contact anglers during fishing activity and may include access-point, roving, and aerial surveys. Off-site surveys solicit information from recreational anglers outside of the fishery such as mail surveys, telephone surveys, online surveys, door-to-door surveys, angler diaries, logbooks, and catch cards. A common issue with off-site angler surveys such as catch cards is nonresponse error, which occurs when an angler refuses or is unable to provide a response (Pollock et al. 1994). Missing data can result from nonresponse error in two forms: 1) unit nonresponse, which occurs when an angler does not respond to any of the survey components, and 2) item nonresponse, when one or more of the components within the survey are left blank (Little 1986). Potential differences in fishing activity between respondents and nonrespondents is a known issue in angler reporting programs and surveys (Pollock et al. 1994; De Gisi 1999; Connelly et al. 2000)and is generally referred to as nonresponse bias. Studies of off-site angler reporting have shown that respondents typically have higher fishing frequency and/or success than nonrespondents (Hicks and Calvin 1964; Brown 1991; Pollock et al. 1994; Bray and Schramm 2001).
Catch cards can be substantially biased due to their self-reporting nature; however, fishery managers continue to use them because they are economical and easy to operate (Pollock et al. 1994). The California Department of Fish and Wildlife (CDFW) has used catch cards for obtaining angler data in California’s recreational steelhead (Oncorhynchus mykiss) fishery, and other state-managed recreational fisheries, for many decades. Reporting of angler catch data in California began as early as the mid-1930s for the purpose of providing information necessary for management and enhancement of fishery resources (Croker 1937; Curtis 1940).
Angler reporting in California’s recreational steelhead fishery, among other similar programs on the west coast of the United States, has suffered from low reporting rates for decades (Jackson 2007; CDFW 2016, 2021; Kraig and Scalici 2021), making it challenging to produce reliable estimates of fishery effort, catch, and harvest. These chronically low response rates indicate that nonresponse bias could be a substantial issue if sociodemographic and fishing activity differences exist between respondents and nonrespondents, as observed in other studies (De Gisi 1999; Bray and Schramm 2001). There are few studies to date that have analyzed trends in angler demographics and behavior over time in the context of fishery resource use or species management and conservation (Dempson et al. 2012; Hunt et al. 2013). Understanding California steelhead angler demographics and behaviors as they relate to the likelihood of angler reporting could be especially helpful for finding solutions to improve reporting rates and data quality.
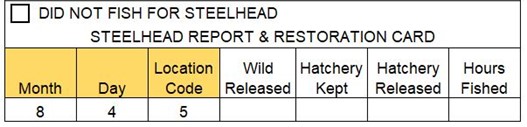
The Steelhead Report and Restoration Card (SRRC) program was implemented in 1993 under California Fish and Game Code, article 6, sections 7380–7382, which requires all recreational anglers fishing for steelhead to possess a valid, nontransferable catch report card issued by CDFW. Steelhead anglers are currently required to record fishing information requested by CDFW on this card (Fig. 1) at the time the fishing effort occurs and must return the card by a certain date determined by CDFW (Fish & G. Code, § 7380(a)). The SRRC program collects data on steelhead angling to monitor catch and effort trends over time, and to generate revenue to fund steelhead habitat restoration projects that will contribute to their recovery (Jackson 2007). Information generated by the SRRC program is used by CDFW to inform pertinent fishery management and regulatory decisions (CDFW 2021).
Angler reporting became mandatory in 2003 (Jackson 2007); however, reporting rates are still consistently low (Bajjaliya 2015; CDFW 2016, 2021). Penalties for nonresponse (i.e., restrictions on purchasing future fishing licenses or an additional fee; Cal. Code of Regs., Title 14 § 1.74, subd. (d)(1)(A)) have not been implemented, which may be contributing to low motivation to return report cards. In addition to returning report cards via mail, California steelhead anglers have had the option to report their catch and effort online through CDFW’s website[1] since 2009 (CDFW 2016). Reporting rates, although still relatively low, did increase after internet reporting became available (Jackson 2007; Bajjaliya 2015; CDFW 2021). Prior to the availability of internet reporting, response rates were typically under 20% (Jackson 2007; Bajjaliya 2015); however, starting in 2009, annual reporting rates have been 25–43% (Bajjaliya 2015; CDFW 2016, 2021).
Nonresponse bias has not been evaluated for the SRRC program thus far, nor has the Department generated expanded estimates of steelhead catch and effort. Previous analyses of California’s steelhead report card data have mostly comprised of syntheses of reported effort, catch, and harvest made publicly available as is required to update the California legislature (Jackson 2007; Bajjaliya 2015; CDFW 2016, 2021). An analysis of angler demographics, reporting methods, and avidity, and how these factors may affect reporting, has not previously been done for the SRRC program. While it is not possible to produce expanded estimates of catch and effort or quantify nonresponse bias using SRRC data alone, understanding the drivers of unit nonresponse error may provide insights into ways in which CDFW can moderate this type of error and improve angler reporting rates. The objectives of this research were to identify 1) demographic trends in reporting rates and methods of reporting (internet vs. mail), and 2) demographic and/or behavioral attributes that predict whether an angler will self-report. Quantitatively addressing these questions will aid in the development of targeted recommendations for how to improve angler reporting and quality of SRRC data.
Methods
Data Processing
We used two datasets in the analyses, both of which were extracted from CDFW’s Automated License Data System (ALDS). This system houses all CDFW hunting and fishing license customer data, vessel permits, and angler and hunter report card data for terrestrial game species, waterfowl, and aquatic species including steelhead. Data in ALDS pertinent to steelhead were available since the 2012 license year and included 1) licensed steelhead report card customer information and 2) SRRC angler-reported effort and catch data. We imported data for each license year into RStudio (RStudio v.1.4.1717, www.rstudio.com) and combined these data to create two full datasets of customer data and SRRC data, respectively, for years 2012–2019. Data from the 2020 license year were omitted from this study due to uncertainties surrounding potential irregularities resulting from the COVID-19 pandemic. We joined customer and SRRC data by document number, resulting in one dataset of individual report cards (n = 418,347).
Pseudo replication can occur if a customer purchases multiple report cards within a single year, and, therefore, the binary outcome of reporting (yes/no) is represented multiple times for one angler. To address this issue, we collapsed multiple report cards bought by a customer within a in a single year into one “annual report” outcome based on the reporting status of those cards for that customer (i.e., all reported vs. all unreported). Customers that exhibited fractional reporting (returned only a portion of their total cards purchased in a year) in any single year were removed from the dataset. We used this single report per angler per year (returned = yes/no) as the metric to calculate reporting rates and resulted in a sample size of n = 395,488.
Statistical Methods
We used linear regression analysis to identify statistically significant relationships in overall reporting rates and internet reporting rates across the study period (Zar 2010). To evaluate differences in mean reporting rates across angler attributes, we compared the following:
- Annual reporting rates by age group
- Annual reporting rates by area of residence
- Annual online reporting rates (proportion reported by internet) by age group
- Annual online reporting rates (proportion reported by internet) by area of residence
The Shapiro-Wilks test for normality (Shapiro and Wilk 1965) and the Levene test for equality of variances (Levene 1960) were used to confirm that the data were normal and equally distributed. For any data that were not normally distributed, we applied a logit transformation. Single-factor ANOVA tests were performed to evaluate the four comparisons listed above (Zar 2010), and we used the Tukey method to determine statistical differences between age groups (Tukey 1977). It should be noted that sample sizes for the ANOVA and Tukey tests were relatively small (n = 8) and additional years of data would increase reliability of the results.
Angler age was calculated by subtracting an angler’s date of birth from their report card purchase date. We selected four age groups for analyses that represent the main social and developmental stages of humans (based on Levinson 1986). Age group 1 includes children to adolescents (5–19 years), age group 2 includes young adults (20–39 years), age group 3 includes middle aged adults (40–64 years), and age group 4 represents older adulthood (65+ years), understanding that these parameters were imposed on life stages for which the boundaries are not strictly defined (Levinson 1986). Reporting rates by age group represent the number of returns out of the total purchases (proportion reported) for each group. Reporting rates by area of residence represent the number of returns out of the total purchases for California residents and non-residents.
We used logistic regression to evaluate the effect of five independent variables of interest (Table 1), representing demographic and behavioral characteristics of anglers, on the log-odds of reporting using the following equation:
ln[odds(Y = 1)] = β0+β1 X1+ β2 X2+ β3 X3…
where Y is the outcome with Y = 1 when the event occurs, e.g., the report card is returned (Y = 0 when the event does not occur), β0 is the intercept, and β1, β2, and β3 represent the regression coefficients for predictor variables X1, X2, and X3, respectively (LaValley 2008).
Table 1. Independent variables used in the logistic regression model to predict odds of angler reporting.
| Independent Variable | Variable Type | Description |
| Age | Continuous | Age of the angler based on their date of birth and date of report card purchase. |
| Region | Categorical | Location categorized by CDFW’s six geographic regions based on county of residence. |
| License Type | Categorical | Lifetime or annual (includes calendar year and short-term licenses). |
| Year Quarter | Categorical | Year quarter 1 (Jan–Mar), year quarter 2 (Apr–June), year quarter 3 (July–Sept), and year quarter 4 (Oct–Dec). |
| Purchase Frequency | Categorical | Infrequent (angler purchased cards in two or fewer years within study period) or frequent (angler purchased cards in three or more years within study period). |
Independent variables included age, area of residence within California, type of fishing license purchased, time of year the card was purchased, and frequency of card purchases over the eight-year study period. We filtered the dataset to only include California residents for the logistic regression analysis. Assessing area of residence within California as a predictor variable is a useful metric allowing a more in-depth look at how location by geographic region may affect likelihood of reporting. Non-residents make up only a small proportion of cardholders (< 8%).
Angling avidity (i.e., frequency of fishing activity) is commonly measured as the number of trips taken by an individual angler over a specified period, which was not possible to quantify for anglers that did not return report cards in this study. Alternatively, we used the type of fishing license purchased and frequency of card purchase (Table 1) as metrics representing angling avidity. Evaluating measures of angling avidity is important to understand potential differences between respondents and nonrespondents that may contribute to nonresponse bias. Previous studies have found that survey respondents are generally more engaged and successful in the fishery compared to nonrespondents (Hicks and Calvin 1964; Brown 1991; Pollock et al 1994; Bray and Schramm 2001). Additionally, it is often assumed that more avid anglers possess different attitudes about management agencies than anglers with lower avidity (Midway et al. 2020), which may influence actions regarding regulation compliance and willingness to self-report fishing data. We assumed lifetime license holders represented higher angling avidity because this license type is only cost-effective if the angler engages in frequent fishing activity. Anglers purchasing steelhead reports cards ≥ 3 times were also assumed to be more avid steelhead anglers than individuals who purchased cards fewer than three times over the study period.
We incorporated interactions between age, license type, and purchase frequency into model selection based on relationships that the authors hypothesized to exist. Age may modify the effect of purchase frequency on reporting if older anglers are more likely to engage in steelhead fishing, potentially due to more free time in retirement, or simply because of more opportunities to fish over time compared to younger anglers. Considering lifetime licenses are most cost-effective for avid anglers, license type may interact with age if angling avidity increases with age, as well as with purchase frequency if lifetime license holders are representative of more active and engaged steelhead anglers.
To meet the assumption of independence between observations, we randomly chose one reporting outcome for each customer (without replacement) across all years to inform the logistic regression model (n = 166,561). We used stepwise model selection using AIC with the R package MuMIn (Bartoń 2022) to determine the most parsimonious model (Burnham and Anderson 2004), and model coefficients were transformed from log-odds to odd ratios for ease of interpretation. Model validation procedures involved evaluating the predictive accuracy of the selected model for a) the randomly sampled dataset used to inform the model and b) all individual years of data. Year-specific data served as test datasets to evaluate the accuracy of the model in predicting reporting outcomes for each year, which first involved removing the records used to inform the logistic model from the full dataset. We drew contingency tables to compare actual to predicted values in the modeled dataset for the purpose of estimating additional validation metrics, such as precision, true positive rate, and true negative rate.
Results
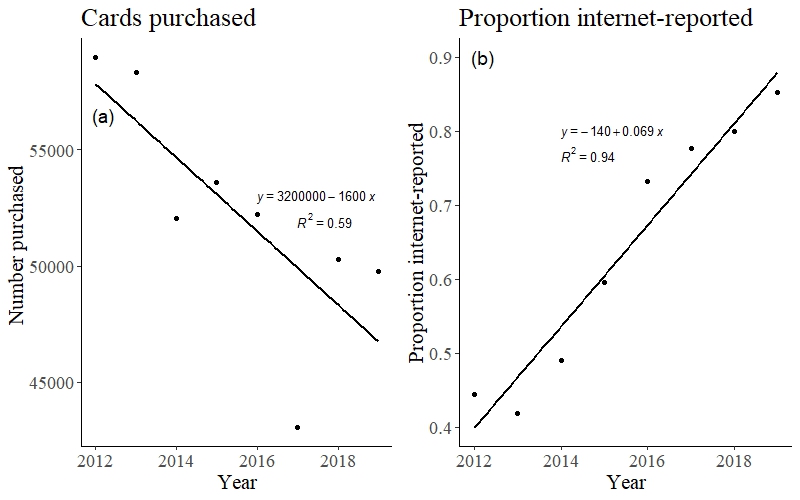
On average, about 52,300 (± 5,055 SD) report cards were purchased in each license year, and data removed due to fractional reporting was < 3%. Across all study years, about 34% (± 5.3% SD) of anglers returned their report card either by mail or by reporting online (Table 2). Card return rates ranged from a high of 42.7% in 2012 to a low of 26.0% in 2013. Linear regression analysis revealed temporal trends in card purchase and reporting. There was a slightly negative trend in total number of report cards purchased from 2012–2019 (F1,6 = 8.574, P = 0.026; Fig. 2a). There was no statistically significant trend in overall reporting rate across study years (F1,6 = 0.061, P = 0.814); however, there was a positive trend in the proportion of cards reported by internet (F1,6 = 97.36, P < 0.001; Fig. 2b).
Table 2. Number of steelhead report cards purchased, number returned, percent of purchased report cards returned, and percent of returned cards reported online per year (2012–2019).
| Year | Cards Purchased | Cards Returned | % Returned | % Online |
| 2012 | 58,993 | 25,255 | 42.8 | 43.5 |
| 2013 | 58,337 | 15,501 | 26.6 | 40.5 |
| 2014 | 52,061 | 15,132 | 29.1 | 47.8 |
| 2015 | 53,598 | 17,368 | 32.4 | 58.4 |
| 2016 | 52,210 | 19,089 | 36.6 | 72.2 |
| 2017 | 43,045 | 16,666 | 38.7 | 76.8 |
| 2018 | 50,309 | 17,882 | 35.5 | 79.0 |
| 2019 | 49,794 | 16,988 | 34.1 | 84.5 |
| Average | 52,293.38 | 17,985.12 | 34.4 | 62.3 |
Variables Affecting Reporting
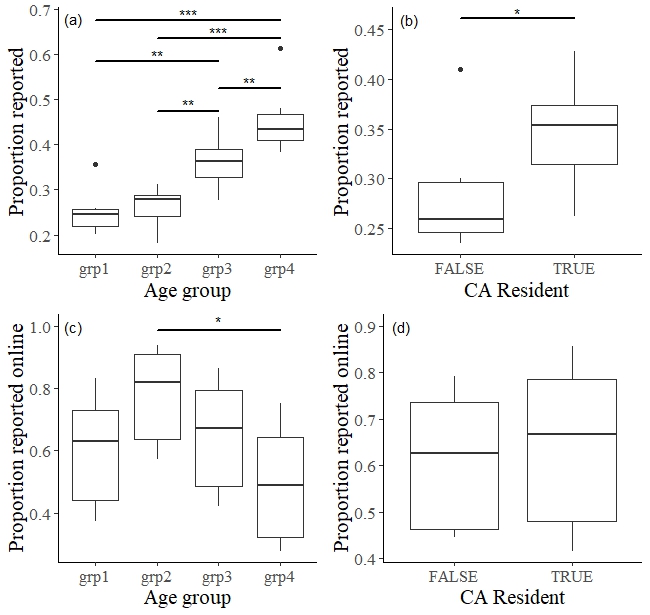
A single-factor ANOVA indicated that there was a significant difference in reporting rates between age groups (F3,28 = 22.67, P < 0.001) across the study period 2012–2019. The Tukey method for single-factor ANOVA showed that the mean reporting rates of all age groups were statistically different from each other, with the exception of age groups 1 and 2 (Fig. 3a). A significant difference in reporting rates was also found between California residents and non-residents (F1,14 = 5.508, P = 0.034; Fig. 3b), and significant differences in internet reporting rates were found between age groups (F3,28 = 3.727, P = 0.023) based on single-factor ANOVA (Fig. 3c). However, the Tukey method indicated that the only age groups with significantly different internet reporting rates were age groups 2 and 4 (Fig. 3c). There was no statistical difference in internet reporting rates between residents and non-residents (F1,14 = 0.143, P = 0.711; Fig. 3d).
The logistic regression model including all five predictor variables (i.e., age, region, license type, year quarter, and purchase frequency) and the age-purchase frequency and age-license type interactions was selected by ΔAIC over alternative models. The model including the license type-purchase frequency interaction also resulted in a ΔAIC < 2 but was not chosen because the additional model complexity did not account for more variation in the data compared to the simpler model. However, interaction terms were likely included in the top models because of the large sample size rather than their explanatory power. We used the R package emmeans (Lenth 2022) to compare the slopes of the relationship of age to reporting across each level of purchase frequency (frequent and infrequent) and license type (lifetime and annual) and found these differences to be minimal. The difference in the slopes between frequent and infrequent purchasers across age was –0.006, and the difference in the slopes between annual and lifetime license holders across age was 0.009. For this reason, we ran model selection by AIC on candidate models including only the main effects (no interactions), resulting in all five predictor variables as the top model (Table 3).
Table 3. Corrected Akaike’s information criterion values ( and degrees of freedom (df) for the five top ranked logistic regression models for the effect of age, region, license type, year quarter, and purchase frequency on the odds of reporting.
| Model | ∆AICc | df |
| Reporting rate ~ Age + Region + License Type + Year Quarter + Purchase Frequency | 0 | 12 |
| Reporting rate ~ Age + License Type + Year Quarter + Purchase Frequency | 93.6 | 7 |
| Reporting rate ~ Age + Region + Year Quarter + Purchase Frequency | 350.4 | 11 |
| Reporting rate ~ Age + Year Quarter + Purchase Frequency | 479.3 | 6 |
| Reporting rate ~ Age + Region + License Type + Purchase Frequency | 1126.1 | 9 |
While all five variables were identified as significant predictors for whether an angler will return their report card (Table 4), most coefficients were relatively small and, therefore, only had a minor effect on the outcome. Age had a statistically significant positive effect on the probability an angler will return their report card (P < 0.001). Although the estimate of the coefficient is small, each subsequent age has a cumulative effect. An angler of any age had 1.014 times the odds of reporting than another angler that was a year younger, and therefore an increase in age by one year increased the odds of reporting by about 1.4%.
Table 4. Estimates of coefficients from the most parsimonious logistic regression model (top model in Table 3).
| Variable | Estimate | SE | Z-value | P-value | Odds Ratio |
| Intercept | –1.91665 | 0.020178 | –94.9889 | < 0.001 | 0.147 |
| Age | 0.014095 | 3.37E–04 | 41.78235 | < 0.001 | 1.014 |
| Region 2 | 0.076339 | 0.015171 | 5.031862 | < 0.001 | 1.079 |
| Region 3 | –0.03416 | 0.015753 | –2.16875 | < 0.05 | 0.966 |
| Region 4 | 0.138732 | 0.025259 | 5.492472 | < 0.001 | 1.149 |
| Region 5 | 0.114618 | 0.026116 | 4.38887 | < 0.001 | 1.121 |
| Region 6 | 0.074238 | 0.051818 | 1.432669 | 0.152 | 1.077 |
| License Type – Lifetime | 0.583133 | 0.030785 | 18.94223 | < 0.001 | 1.792 |
| Year Quarter 2 | –0.25867 | 0.017492 | –14.788 | < 0.001 | 0.772 |
| Year Quarter 3 | 0.037116 | 0.016313 | 2.275286 | < 0.05 | 1.038 |
| Year Quarter 4 | 0.345113 | 0.014132 | 24.42014 | < 0.001 | 1.412 |
| Purchase Frequency – 1 | 0.629213 | 0.012479 | 50.42346 | < 0.001 | 1.876 |
Estimates of coefficients for each region were all small, indicating regional groups were weak predictors for whether an angler will report. The odds of reporting were slightly greater in regions 2, 4, and 5 (range = 1.08–1.15, or 8–15% higher) compared to region 1 (referent), and slightly less in region 3 (0.97, or 3% lower) than in region 1 (Table 4). The odds of reporting for anglers with a lifetime license were 1.792 times greater (i.e., 79% greater odds) than for anglers who had either a short-term or annual license (referent) and 1.876 times (87.6%) greater for frequent card purchasers than infrequent card purchasers (referent) (Table 4). Compared to cards purchased in year quarter 1 (referent), the odds of reporting were 23% lower for cards purchased in year quarter 2 (0.772) and only 3.8% (1.038) greater for cards purchased in quarter 3. The odds of reporting were the highest for cards purchased in quarter 4, which were 41.2% greater (1.412) compared to quarter 1.
The selected model (Table 3) performed relatively well, with an accuracy of about 73%, when used to predict reporting for each angler in the dataset. The true positive rate (i.e., the rate at which the model accurately predicted “true” for the reported events), or recall, was low (5%). In contrast, the true negative rate was very high, with the model predicting non-reporting for about 99% of actual non-reporting events. Model precision was 58% and the F-score was 0.094, indicating that the model did not explain the full scope of impacts on angler reporting. The model predicted reporting for test datasets representing individual reporting years (2012–2019) moderately well, with accuracies ranging from 55–67%.
Discussion
In this study, we leveraged demographic data collected in the SRRC program to 1) elucidate trends in card returns and 2) determine whether angler attributes could reliably predict whether an angler will return their report card. All age groups exhibited significantly different reporting rates except for children and adolescents (group 1, 1–19 years) and young adults (group 2, 20–39 years) (Fig. 2a), demonstrating that reporting rates generally increase with age, as observed in other studies (Dorow and Arlinghaus 2011; Dempson et al. 2012; Gigliotti and Dietsch 2014; Gigliotti and Henderson 2015). Temporal trends in internet reporting revealed a significant increase in the proportion of anglers returning their report card online as opposed to mail-in (Fig. 2b), illustrating the increasing use and awareness of online resources for submitting fishery data. Online reporting was significantly higher in young adults (age group 2, 20–39 years) compared to older adults (age group 4, 65+ years) (Fig. 3c), though older adults had the highest rate of reporting out of all age groups overall (mail-in and internet reporting combined, Fig. 3a). California residents had significantly higher reporting rates than non-residents (Fig. 3b), which could be attributed to several factors. California residents may have a higher awareness of fishing laws and regulations compared to non-residents, or implications of breaking California state fishing regulations may be perceived as less severe to out of state residents compared to in-state card holders.
Although the variables modeled in the logistic regression analysis could not fully explain the variation in angler reporting, the larger effect size of age, purchase frequency, and license type indicate that older, more avid anglers are more likely to return their report cards (Table 4). Results showed that the odds of angler reporting increased by 1.4% with each year, indicating that the older an angler is, the more likely they are to report. Additionally, anglers with a lifetime license were 79% more likely to report than those with an annual or short-term license, and anglers that purchased steelhead report cards more frequently were 88% more likely to return them (Table 4). While we cannot quantify angling avidity in terms of trips taken, higher purchase frequency of steelhead report cards and lifetime license type (versus annual or short-term) likely represent anglers that are generally more avid and engaged in the fishery.
Other studies looking at angler demographics and behavior in relation to survey response have had similar results regarding age and avidity (Dorow and Arlinghaus 2011; Dempson et al. 2012; Gigliotti and Dietsch 2014; Gigliotti and Henderson 2015). Off-site angler surveys conducted to obtain fishery harvest and effort data in Germany, Newfoundland, and Canada have shown that respondents are typically older and more avid anglers than nonrespondents (Dorow and Arlinghaus 2011; Dempson et al. 2012). Young anglers in recreational South Dakota fisheries had the lowest response rates of all age groups for multiple mixed-method angler surveys (Gigliotti and Dietsch 2014; Gigliotti and Henderson 2015; Henderson and Gigliotti 2018). Gigliotti and Henderson (2015) found that response rates were the lowest among young anglers for both mail and internet survey components, while senior anglers had the highest response rates for both survey components.
The time of year that a report card was purchased was also a significant predictor of reporting. The odds of reporting were 41% higher for anglers that purchased cards in the last quarter of the year (Oct– Dec) and 23% lower for anglers purchasing cards in the second quarter of the year (Apr– June) compared to those that purchased in the first quarter (referent) of the year (Jan–Mar) (Table 4). Adult winter steelhead return to freshwater between October and April, with the peak of migration typically occurring in January and February (Lee 2020). Therefore, cards purchased in the first and last quarters of the year are likely purchased during the steelhead fishing season, and cards purchased in the second and third quarters of the year are generally outside of steelhead season. Card purchases that coincide with the migration timing of the species may represent more knowledgeable and experienced (and therefore, more avid) anglers compared to those purchasing cards outside of the typical steelhead fishing season. Although an angler’s region of residence was a significant predictor variable for whether an angler would return their card, differences in likelihood of reporting were not substantial between regions. Compared to region 1 (referent), the odds of reporting were marginally higher for regions 2, 4, and 5, and only slightly lower for region 3 (Table 4). Had the regression coefficients been larger, they would have indicated a greater difference in the likelihood of reporting between regions.
Follow-up surveys of nonrespondents are a potential means of improving SRRC reporting rates, which were low across the 2012–2019 study period (mean = 34.1% ± 5.3% SD). Self-reporting without follow-up surveys typically does not elicit a high enough response rate to eliminate severe bias (Lukacs et al. 2011). Follow-up surveys sent to all cardholders may not be the most effective way to increase response rates (Gigliotti and Fopma 2019; Kraig and Scalici 2021), and specifically targeting nonrespondents is more likely to improve nonresponse bias (Crompton and Tian-Cole 2001). Reminder postcards were sent to SRRC nonrespondents from the 2003 and 2004 license years and achieved relatively high response rates (Jackson 2007). Although California recreational fishing license holders can currently opt in to receive email reminders from CDFW about important fishery deadlines, implementing follow-ups that specifically target SRRC nonrespondents could help increase reporting rates and limit bias associated with nonresponse (Lukacs et al. 2011).
Only select questions regarding the demographics and behavior of respondents vs. nonrespondents in the SRRC program could be answered with the data available for this study. These answers shed light on the demographic variables impacting reporting, but they did not reveal the magnitude of nonresponse bias present. Unless response rate is high enough to eliminate substantial bias, the presence of nonresponse bias should be assumed in any survey (Fisher 1996). Determining the causes of nonresponse bias and being able to correct for the bias is essential in the utilization of survey results (Fisher 1996; Barriball and While 1999). Response rate can expose the potential existence of nonresponse bias but does not necessarily indicate poor survey data quality if variables assessed within the survey are similar between respondents and nonrespondents (Peytchev et al. 2009; Wagner 2012; Kreuter 2013; Peytchev 2013), nor does it allow prediction of the degree of nonresponse bias in survey estimates (Groves 2006). Merely increasing response rate does not guarantee a decrease in the magnitude of nonresponse bias because there is no straightforward correlation between the two (Groves 2006). It is important to evaluate any quantifiable differences between respondents and nonrespondents to determine the degree of nonresponse bias and correct for the bias whenever response rates are lower than 100% (Lew et al. 2015).
Weighting is a method that can be used to remove nonresponse bias when differences between respondents and nonrespondents are known (Little 1986). A logit model can be used to determine differences between survey respondents and nonrespondents and then variables for which there are significant differences between groups can be used to calculate nonresponse adjustment weights for unit nonresponse (Lew et al. 2015). When supplementary information is not available to determine differences between groups, follow-up surveys can be conducted to obtain this information (Lew et al. 2015). Angler diarists from a mixed-method survey conducted in Germany were weighted against a random sample of resident anglers to correct for nonresponse bias, which led to lower estimates of catch and harvest than unweighted estimates (Dorow and Arlinghaus 2011). A survey of California spiny lobster (Panulirus interruptus) report cardholders showed that 40% of non-reporters did not fish compared to only 20% of reporters (CDFW 2020) confirming the existence of significant differences in angler behavior between the two groups. A similar survey of SRRC anglers could help assess if there are significant differences in fishery participation or success between respondents and nonrespondents and allow for nonresponse bias correction.
A one-time survey of nonrespondents in the SRRC program could also be conducted to determine reasons for nonresponse (Pollock et al. 1994). Understanding why certain cardholders are not returning their report cards could be useful in identifying targets for outreach to achieve higher response rates overall. Potential reasons for nonresponse could be that the angler did not have time, lost their card, did not know how to report, does not support fishery management tools used by CDFW, was confused because the steelhead report card was based on calendar year rather than the steelhead fishing season, or did not fish and did not think their data were needed (McPhillips et al. 1985; Ditton and Hunt 1996; De Gisi 1999; Gigliotti and Henderson 2015).
Penalties for nonresponse could be an effective way to motivate steelhead anglers to turn in their cards. Fines can have a positive effect on response rates in self-reporting hunting and fishing programs (Rupp et al. 2000). Response rates have increased since CDFW implemented mandatory reporting for deer hunters in 2015 with a $21.60 fine for not reporting a tag . Since the fine was applied, annual reporting rates have hovered around 75%, which is substantially higher than SRRC response rates (Julie Garcia, CDFW, personal communication).
A similar penalty was implemented in 2013 for the recreational spiny lobster fishery, and it raised annual reporting rates from 12–33% to about 50% (Jennifer Hofmeister, CDFW, personal communication). Although this is a notable increase, lobster fishery reporting rates are still lower than current deer hunting reporting rates. A major challenge with enforcing the recreational lobster penalty has been processing the large volume of contestations each season from fishery participants who have incurred fines due to nonresponse (Jennifer Hofmeister, CDFW, personal communication). This negative response should be considered when implementing penalties in other report card programs like the SRRC. The ideal scenario would be for altruism alone to motivate reporting rather than fear of a consequence (Snyder et al. 2021) but applying penalties may be necessary to achieve sufficiently high reporting rates for the SRRC. The level of increase in SRRC reporting rates resulting from a penalty is unknown given the differences in post-penalty reporting rates for CDFW’s deer and lobster programs. Rewards have also been used to encourage higher angler reporting rates, especially in tagging studies used to estimate species survival rates and fishery mortality (Pollock et al. 2001; Taylor et al. 2006; Meyer et al. 2012). However, the reward must be sufficiently high in monetary value, i.e., greater than $100, to elicit high return rates (Nichols et al. 1991; Pollock et al. 2001), thus, it is unlikely the SRRC program will employ this method to increase reporting due to funding limitations.
A newly developed method of angler reporting via smartphone application (app) could be another way to increase self-reporting and data accuracy (McCormick 2017; Venturelli et al. 2017; Taylor et al. 2021). Smartphone apps have the potential to increase accessibility and ease of reporting, mitigate issues with anglers remembering to report at the end of a season, and reduce chances of an angler losing their report card and being unable to report. This method could also be used for real-time tracking of catch and effort in the fishery, which may allow for in-season management rather than only retrospective management (Venturelli et al. 2017). Although it would take some time for anglers to become accustomed to catch reporting on an app in place of more traditional methods, ultimately app reporting could be a useful tool to increase precision of fishery data and estimates (Taylor et al. 2021). Since internet reporting became an option for the SRRC program, overall return rates have been higher than they were prior to the availability of online reporting (Jackson 2007; CDFW 2021). This positive response to online reporting, as well as the upward trend detected in online reporting by anglers who reported during the study period, suggest an increased willingness to accept and utilize more contemporary reporting methods, and may bode well for the development of a smartphone app.
Management Recommendations
Although some initial questions surrounding the characteristics of SRRC nonrespondents were addressed in this study, many unknowns still exist with regards to nonresponse bias in SRRC data. This study revealed that older, more avid anglers (as represented by higher card purchase frequency and possession of a lifetime license) were more likely to report their steelhead catch and effort data, thus, CDFW could consider focusing outreach and education on younger anglers entering the fishery. Younger anglers had significantly higher online reporting rates compared to older anglers, and promoting online resources related to report card information and education across additional platforms (e.g., social media) may better target this demographic. Additionally, sending annual reminders to nonrespondents may improve reporting rates for those that are not as active and engaged in the fishery.
Moving forward, CDFW would benefit from implementing follow-up surveys of anglers who do not return their steelhead report cards to assess potential variance in catch and effort between respondents and nonrespondents. The SRRC program is not currently able to produce comprehensive estimates of angler catch and effort due to low return rates and, thus, unreliability of the data. Follow-up surveys of nonrespondents could provide the means to correct for nonresponse bias through some method of weighting data and allow for reliable estimation of total effort and catch by steelhead anglers statewide. These estimates would be indispensable management tools that are not consistently available for California’s recreational steelhead fishery in all regions.
In addition to implementing an annual follow-up survey of nonrespondents, it would be helpful for CDFW managers to understand the underlying reasons behind angler nonresponse. CDFW could benefit from conducting a one-time survey of nonrespondents inquiring why they did not return their cards. These answers will provide further insight into potential ways to increase reporting, such as the need for additional outreach or a more accessible reporting mechanism to allow for more immediate reporting. Penalties for nonresponse may be effective in soliciting greater report card return rates; however, negative incentives should be a last resort if other options are available. Reaching out to anglers to better understand their behavior and motivations may prove to be the best way to not only enhance SRRC data, but to garner support for the program and educate anglers about the value of the data they provide through self-reporting.
Acknowledgements
We would like to thank R. Kurth (California Department of Water Resources, previously CDFW), who provided support and guidance on the development and implementation of this study. Thank you to D. Martinez (CDFW) who assisted with data extraction and interpretation. Additional thanks go to J. Kelly (CDFW), R. Titus (CDFW), and J. Nelson (CDFW) for their review of this manuscript, and to J. Hofmeister (CDFW) and A. Barros (CDFW) for their assistance with statistical methods.
Literature Cited
- Bajjaliya, F. S. 2015. Steelhead Report and Restoration Card Program: 2006–2011. Administrative Report 2015-01, California Department of Fish and Wildlife, Sacramento, CA, USA.
- Barriball, K. L., and A. E. While. 1999. Non-response in survey research: a methodological discussion and development of an explanatory model. Journal of Advanced Nursing 30(3):677–686. https://doi.org/10.1046/j.1365-2648.1999.01117.x
- Bartoń, K. 2022. MuMIn: Multi-Model Inference. R package version 1.47.1. Available from: https://CRAN.R-project.org/package=MuMIn
- Bray, G. S., and H. L. Schramm. 2001. Evaluation of a statewide volunteer angler diary program for use as a fishery assessment tool. North American Journal of Fisheries Management 21(3):606–615. https://doi.org/10.1577/1548-8675(2001)021<0606:eoasva>2.0.co;2
- Brown, T. L. 1991. Use and abuse of mail surveys in fisheries management. American Fisheries Society Symposium 12:255–261.
- Burnham, K. P., and D. R. Anderson. 2004. Multimodel inference: understanding AIC and BIC in model selection. Sociological Methods Research 33(2): 261–304. https://doi.org/10.1177/0049124104268644
- California Department of Fish and Wildlife (CDFW). 2016. Steelhead Report and Restoration Card Program: Report to the Legislature 2007–2014. California Department of Fish and Wildlife, Sacramento, CA, USA.
- California Department of Fish and Wildlife (CDFW). 2020. New method for estimating unreported recreational lobster catch and effort improves estimates of total catch and effort for the fishery. California Department of Fish and Wildlife, Sacramento, CA, USA. http://www.dfg.ca.gov/marine/mpa/overview.asp
- California Department of Fish and Wildlife (CDFW). 2021. Steelhead Report and Restoration Card Program: Report to the Legislature 2015-2019. California Department of Fish and Wildlife, Sacramento, CA, USA.
- Connelly, N. A., T. L. Brown, and B. A. Knuth. 2000. Assessing the relative importance of recall bias and nonresponse bias and adjusting for those biases in statewide angler surveys. Human Dimensions of Wildlife 5(4):19–29. https://doi.org/10.1080/10871200009359192
- Croker, R. S. 1937. How California is measuring the angler’s catch. Transactions of the American Fisheries Society 66(1):301–305.
- Crompton, J. L., and S. Tian-Cole. 2001. An analysis of 13 tourism surveys: Are three waves of data collection necessary? Journal of Travel Research 39(4):356–368. https://doi.org/10.1177/004728750103900402
- Curtis, B. 1940. Anglers’ catch records in California. Transactions of the American Fisheries Society 69(1):125–131.
- De Gisi, J. S. 1999. Precision and bias of the British Columbia steelhead harvest analysis British Columbia. Skeena Fisheries Report SK 12, Ministry of Environment, Lands and Parks, Smithers, B.C., Canada. http://a100.gov.bc.ca/appsdata/acat/documents/r337/Degisi1999_1064862014064_70f9f641aa8f4fabb134b5d8645fb9a6.pdf
- Dempson, J. B., M. J. Robertson, N. M. Cochrane, M. F. O’Connell, and G. Porter. 2012. Changes in angler participation and demographics: analysis of a 17-year license stub return system for Atlantic salmon. Fisheries Management and Ecology 19:333–343. https://doi.org/10.1111/j.1365-2400.2012.00848.x
- Ditton, R. B., and K. M. Hunt. 1996. Demographics, participation, attitudes, management preferences, and trip expenditures of Texas anglers. Technical Document #HD-605, Texas A&M University, College Station, TX, USA.
- Ditton, R. B., and K. M. Hunt. 2001. Combining creel intercept and mail survey methods to understand the human dimensions of local freshwater fisheries. Fisheries Management and Ecology 8:295–301.
- Dorow, M., and R. Arlinghaus. 2011. A telephone-diary-mail approach to survey recreational fisheries on large geographic scales, with a note on annual landings estimates by anglers in northern Germany. American Fisheries Society Symposium 75:319–344.
- Fisher, M. R. 1996. Estimating the effect of nonresponse bias on angler surveys. Transactions of the American Fisheries Society 125:118–126.
- Gigliotti, L., and A. Dietsch. 2014. Does age matter? The influence of age on response rates in a mixed-mode survey. Human Dimensions of Wildlife 19(3):280–287. https://doi.org/10.1080/10871209.2014.880137
- Gigliotti, L., and S. Fopma. 2019. Low survey response! Can I still use the data? Human Dimensions of Wildlife 24(1):71–79. https://doi.org/10.1080/10871209.2018.1523508
- Gigliotti, L., and K. Henderson. 2015. Reasons anglers did not respond to an internet survey and evaluation of data quality. Proceedings of the South Dakota Academy of Science 94:155–170.
- Groves, R. M. 2006. Nonresponse rates and nonresponse bias in household surveys. Public Opinion Quarterly 70(5):646–675. https://doi.org/10.1093/poq/nfl033
- Gundelund, C., R. Arlinghaus, H. Baktoft, K. Hyder, P. Venturelli, and C. Skov. 2020. Insights into the users of a citizen science platform for collecting recreational fisheries data. Fisheries Research 229:105597. https://doi.org/10.1016/j.fishres.2020.105597
- Henderson, K., and L. Gigliotti. 2018. Evaluation of internet surveys for conducting statewide angler surveys in South Dakota. Proceedings of the South Dakota Academy of Science 97:35–50.
- Hicks, R. H., and L. D. Calvin. 1964. An evaluation of the punch card method of salmon-steelhead sport catch. Technical Bulletin 81, Oregon State University, Agricultural Experiment Station, Corvalis, OR, USA.
- Hunt, L. M., S. G. Sutton, and R. Arlinghaus. 2013. Illustrating the critical role of human dimensions research for understanding and managing recreational fisheries within a social-ecological system framework. Fisheries Management and Ecology 20:111–124. https://doi.org/10.1111/j.1365-2400.2012.00870.x
- Jackson, T. A. 2007. California Steelhead Fishing Report-Restoration Card: a report to the legislature. California Department of Fish and Game, Sacramento, CA, USA.
- Koemle, D., B. Beardmore, M. Dorow, and R. Arlinghaus. 2021. The human dimensions of recreational anglers targeting freshwater species in coastal ecosystems, with implications for management. North American Journal of Fisheries Management 41:1572–1590. https://doi.org/ 10.1002/nafm.10672
- Kraig, E., and T. Scalici. 2021. Washington State Sport Catch Report 2019. Washington Department of Fish and Wildlife, Olympia, WA, USA. https://wdfw.wa.gov/sites/default/files/publications/02257/wdfw02257.pdf
- Kreuter, F. 2013. Facing the nonresponse challenge. Annals of the American Academy of Political and Social Science 645(1):23–35. https://doi.org/10.1177/0002716212456815
- LaValley, M. P. 2008. Logistic regression. Circulation 117(18):2395–2399. https://doi.org/10.1161/CIRCULATIONAHA.106.682658
- Lee, D. P. 2020. California Winter Steelhead: Life History and Fly Fishing. Gardull Graphics, El Dorado Hills, CA, USA.
- Lenth, R. 2022. emmeans: estimated marginal means, aka least-squares means. R package version 1.8.1-1. Available from: https://CRAN.R-project.org/package=emmeans
- Levene, H. 1960. Robust tests for equality of variances. Pages 278–292 in I. Olkin, editor. Contributions to Probability and Statistics. Stanford University Press, Redwood City, CA, USA.
- Levinson, D. J. 1986. A conception of adult development. American Psychologist 41(1):3–13.
- Lew, D. K., A. Himes-Cornell, and J. Lee. 2015. Weighting and imputation for missing data in a cost and earnings fishery survey. Marine Resource Economics 30(2):219–230. https://doi.org/10.1086/679975
- Little, R. J. A. 1986. Survey nonresponse adjustments. International Statistical Review 54:139–157.
- Lukacs, P. M., J. A. Gude, R. E. Russell, and B. B. Ackerman. 2011. Evaluating cost-efficiency and accuracy of hunter harvest survey designs. Wildlife Society Bulletin 35(4):430–437. https://doi.org/10.1002/wsb.61
- McCormick, J. L. 2017. Evaluation of methods to estimate salmon harvest using angler harvest permits available on a smartphone application. North American Journal of Fisheries Management 37(1):1–8. https://doi.org/10.1080/02755947.2016.1221005
- McPhillips, K. B., R. L. Linder, and W. A. Wentz. 1985. Nonreporting, success, and wounding by South Dakota deer bowhunters–1981. Wildlife Society Bulletin 13(4):395–398.
- Meyer, K. A., F. S. Elle, J. A. Lamansky, Jr., E. R. J. M. Mamer, and A. E. Butts. 2012. A reward-recovery study to estimate tagged-fish reporting rates by Idaho anglers. North American Journal of Fisheries Management 32:696–703. https://doi.org/10.1080/02755947.2012.685142
- Midway, S. R., J. Adriance, P. Banks, S. Haukebo, and R. Caffey. 2020. Electronic self-reporting: angler attitudes and behaviors in the recreational Red Snapper fishery. North American Journal of Fisheries Management 40(5):1119–1132. https://doi.org/10.1002/nafm.10472
- Nichols, J. D., R. J. Blohm, R. E. Reynolds, R. E. Trost, J. E. Hines, and J. P. Bladen. 1991. Band reporting rates for mallards with reward bands of different dollar values. Journal of Wildlife Management 55:119–126.
- Peytchev, A. 2013. Consequences of survey nonresponse. Annals of the American Academy of Political and Social Science 645(1):88–111. https://doi.org/10.1177/0002716212461748
- Peytchev, A., R. K. Baxter, and L. R. Carley-Baxter. 2009. Not all survey effort is equal: reduction of nonresponse bias and nonresponse error. Public Opinion Quarterly 73(4):785–806. https://doi.org/10.1093/poq/nfp037
- Pollock, K. H., J. M. Hoenig, W. S. Hearn, and B. Calingaert. 2001. Tag reporting rate estimation: 1. An evaluation of the high-reward tagging method. North American Journal of Fisheries Management 21:521–532.
- Pollock, K. H., C. M. Jones, and T. L. Brown. 1994. Angler survey methods and their applications in fisheries management. American Fisheries Society Special Publication 25, American Fisheries Society, Bethesda, MD, USA.
- Rupp, S. P., W. B. Ballard, and M. C. Wallace. 2000. A nationwide evaluation of deer hunter harvest survey techniques. Wildlife Society Bulletin 28(3):570–578.
- Shapiro, S. S., and M. B. Wilk. 1965. An analysis of variance test for normality (complete samples). Biometrika 52:591–611.
- Snyder, H. T., S. Eckstein, M. E. Cox, S. B. Hansen, and C. Connors. 2021. Deterrents and nudges improve compliance in Greenland’s Atlantic salmon (Salmo salar) fishery. ICES Journal of Marine Science 78(8):2809–2817.
- Taylor, A. T., A. M. Peeper, B. Chapagain, O. Joshi, and J. M. Long. 2021. Modern reporting methods for angler tag-return studies: trends in data quality, choice of method, and future considerations. North American Journal of Fisheries Management 42:189–199.
- Taylor, R. G., J. A. Whittington, W. E. Pine, III, and K. H. Pollock. 2006. Effect of different reward levels on tag reporting rates and behavior of common snook anglers in Southeast Florida. North American Journal of Fisheries Management 26:645–651. https://doi.org/ 10.1577/M04-185.1
- Tukey, J. W. 1977. Exploratory Data Analysis. Pearson, London, UK.
- Venturelli, P. A., K. Hyder, and C. Skov. 2017. Angler apps as a source of recreational fisheries data: opportunities, challenges and proposed standards. Fish and Fisheries 18(3):578–595. https://doi.org/10.1111/faf.12189
- Wagner, J. 2012. A comparison of alternative indicators for the risk of nonresponse bias. Public Opinion Quarterly 76(3):555–575. https://doi.org/10.1093/poq/nfs032
- Wilde, B. G. R., R. B. Ditton, S. R. Grimes, and R. K. Riechers. 1996. Status of human dimensions surveys sponsored by state and provincial fisheries management agencies in North America. Fisheries 21(11):12–17.
- Zar, J. H. 2010. Biostatistical Analysis. 5th edition. Prentice Hall/Pearson, Hoboken, NJ, USA.
[1] https://wildlife.ca.gov/Conservation/Inland-Fisheries/Steelhead-Report-Card