

FULL RESEARCH ARTICLE
Miranda B. Haggerty1* and Chuck Valle2
1 California Department of Fish and Wildlife, South Coast Region, 3883 Ruffin Road, San Diego, CA 92123, USA ![]() https://orcid.org/0009-0009-9510-6767
https://orcid.org/0009-0009-9510-6767
2 California Department of Fish and Wildlife, South Coast Region, 4665 Lampson Avenue, Los Alamitos, CA 90720, USA
*Corresponding Author: Miranda.Haggerty@wildlife.ca.gov
Published 28 March 2024 • doi.org/10.51492/cfwj.110.4
Abstract
The Giant Sea Bass is an apex predator of southern California kelp forests that historically supported large commercial and recreational fisheries but whose population was drastically reduced due to overfishing. Although regulations have been in place to protect Giant Sea Bass for over 30 years, there is concern for continued allowance of their incidental take in commercial gill net fisheries. Through landing records, logbooks, and federal observer data, we examined the commercial take of Giant Sea Bass to determine the: magnitude, location, age, and disposition of catch; whether this take was incidental or targeted; and its impact on the current population. We found that Giant Sea Bass landings declined since gill netting was banned in state waters in 1994 and their overall landings decreased by 75% since becoming protected in 1981. Over time, a greater proportion of older fish was seen in the landings with an increase in mature individuals over 13 years of age since 2000. We found no evidence that commercial fishers are targeting Giant Sea Bass. On average, Giant Sea Bass were landed on 4.2% of gill net trips from 1994 to 2021. Additionally, over the past decade the majority of Giant Sea Bass landings came from only 15 permit holders, but this made up only ~2% of their total landings in pounds as these are the most active permittees, bringing in the highest landings of White Seabass or California Halibut. Assessing gill net observer data, we found the mortality of released Giant Sea Bass is high at 72%, although despite this level of mortality, multiple fishery independent sources indicate Giant Sea Bass populations are increasing, suggesting that current protection measures may be effective. Despite these findings, it is challenging to interpret the full impact of the commercial fishery on Giant Sea Bass as an accurate measure of total discards is unknown without consistent observer coverage.
Key words: bycatch, commercial fishery, fishery management, Giant Sea Bass, set gill net, Stereolepis gigas
| Citation: Haggerty, M. B., and C. Valle. 2024. Incidental take of Giant Sea Bass in the gill net fishery. California Fish and Wildlife Journal 110:e4. |
| Editor: Morgan Ivens-Duran, Marine Region |
| Submitted: 7 July 2023; Accepted: 31 August 2023 |
| Copyright: ©2024, Haggerty and Valle. This is an open access article and is considered public domain. Users have the right to read, download, copy, distribute, print, search, or link to the full texts of articles in this journal, crawl them for indexing, pass them as data to software, or use them for any other lawful purpose, provided the authors and the California Department of Fish and Wildlife are acknowledged. |
| Competing Interests: The authors have not declared any competing interests. |
Introduction
The Giant Sea Bass (GSB) (Stereolepis gigas) are the largest bony fish in the nearshore rocky reefs and kelp forest habitats of the northeastern Pacific. The GSB range spans from Humboldt Bay, CA to Oaxaca, Mexico, and into the Gulf of California, although they are most common south of Point Conception (Love and Passarelli 2020). Giant Sea Bass are long-lived and slow growing, reaching record weights of over 500 lbs (225 kg) and estimated to live at least 76 years (Hawk and Allen 2014). GSB have a larger role as apex predators in the shallow reef community, since they are generalists capable of feeding on nearly any species (Horn and Ferry-Graham 2006); however, due to their large size, aggregative spawning behavior, and ease of capture, overfishing has decreased their population (Chabot et al. 2015; House et al. 2016; Clevenstine and Lowe 2021).
The GSB fishery has been active and popular throughout California’s history. The GSB commercial fishery began in California in 1870 and peaked in 1932 at 200,000 lbs (90,720 kg ) before declining to below 40,000 lbs (18,150 kg ) in 1980. Commercial fishers found targeting GSB in Mexican waters was even more productive, with GSB landings peaking four times higher than California at 800,000 lbs (362,900 kg) in 1932, but permanently dropping below 200,000 lbs (90,720 kg) in 1964. The recreational fishery for GSB peaked later than the commercial, reaching its maximum landings for California in 1963 and 10 years later for GSB caught and imported from Mexican waters. During this time, fishing trips targeted aggregations and caught up to 250 GSB in a three-day fishing trip (Baldwin and Keiser 2008). GSB catch in both commercial and recreational fisheries quickly declined in the mid-late 1960s to historic low levels in the 1970s and beyond.
Due to the critically low population status of the GSB fisheries in the mid-late 1970s, a law was passed in 1981 prohibiting the take of GSB for any purpose; however, an exception was made to allow gill and trammel net fishers to take and sell no more than two fish per vessel if caught incidentally (Fish & G. Code, §8380). This was reduced to one per vessel in 1988, which is the current regulation (Fish & G. Code, §8380). Additionally, restrictions allow 1,000 lbs (~450 kg) of GSB per trip with a total limit of 3,000 lbs (~1,360 kg) of GSB per vessel per year taken south of the U.S.–Mexico boundary (Fish & G. Code, §8380). In 1994, Proposition 132 banned gill net fishing in state waters, which indirectly protected GSB populations three nautical miles (~4.8 km) off the mainland and one nautical mile surrounding the islands (Fish & G. Code, §8610.3). Gill nets include two types, set nets that are anchored to the bottom and drift nets that float and are free to move with the tide and current. The set gill net fisheries incidentally catch the majority of GSB, and primarily target California Halibut (Paralichthys californicus) with 8.5 in (21.6 cm) minimum mesh size (Fish & G. Code, §8625) or White Seabass (Atractoscion nobilis) with 6-in (15.2 cm) minimum mesh size (Fish & G. Code, §8623). Drift gill nets targeting highly migratory species have been phased out since 2020 (Fish & G. Code, §8583) and caught significantly less GSB. For the recreational fishery, no GSB may be taken off California, although two GSB per angler per trip is allowed when fishing south of the U.S.–Mexico border with a valid fishing license from the Mexican government (Cal. Code Regs., tit.14, §28.10).
Due to the protected status of GSB, there has been concern for the incidental take of GSB permitted in the gill net fishery. The objective of this study is to evaluate GSB catch by assessing 1) annual GSB landings from commercial fisheries, 2) age classes of GSB caught in the gill net fishery, 3) the accuracy of fisher reported gill net logs, 4) the estimated Catch Per Unit Effort of GSB taken in the set gill net fishery, and 5) the possibility of targeting GSB in the gill net fishery.
Methods
We used three data sources, landing receipts, gill net logbooks, and observer data. Landing receipts are submitted to the California Department Fish and Wildlife’s (CDFW) Marine Landings Data System (MLDS) as a direct record of the pounds of fish sold. Number of GSB landed can be estimated with landing receipts after 1988 when it became illegal to keep more than one GSB per trip. Logbooks are self-reported observations of catch in numbers of fish as the set gill net fishery is one of 15 fisheries required to submit a record of fishing operations in a logbook. Logs are supposed to include kept and discarded and are available from 1981–2021. Observer data is a direct observation of catch and disposition from the National Marine Fisheries Service (NMFS) Observer Program which observed 3,333 trips over eleven years (1990–2017), which is approximately 12% coverage. Each of these sources report the location of landings or catch using CDFW fishing blocks.
Annual GSB Landings
We compiled the annual commercial landings (lbs) of GSB by gear type and location from landing receipts from 1969–2021. These landings were grouped into three time periods based on major regulation changes providing varying levels of protection as mentioned above: 1) no regulations for GSB (1969–1980); 2) only incidental catch of 1–2 GSB per trip allowed (1981–1993); and 3) same as 2) plus gill nets were banned in nearshore waters (1994–present). Landing receipts only include GSB landed in California, although they can be caught in both California and Mexican waters. Prior to 1994, it is difficult to distinguish between set and drift gill nets on landing receipts, so they are listed as unspecified gill nets. We extracted data from gill net logbooks and self-reported catch to compare to landing receipts. Landing receipts were used to estimate the total count of GSB taken in the gill net fishery.
Lengths and Ages of GSB Caught in Set Gill Net Fishery
We used the MLDS landing receipts to determine lengths and ages of incidentally caught GSB. To estimate the age class of a single GSB landing, we converted the reported weight into standard length using a length-weight model estimated for GSB (Williams et al. 2013). This length was then used in a von Bertalanffy growth model to estimate age (Hawk and Allen 2014). To ensure the pounds reported per trip were from a single GSB as regulations specify, we compared landings to the gill net logbook records and removed all accounts where more than one GSB was recorded as retained. Additionally, as the condition of landed fish varies, we removed all cases where GSB were reported gutted or dressed in any form and used only intact GSB weights in the age estimation.
Accuracy of Fisher Reported Gill Net Logbooks
To assess the accuracy of the mandated gill net logbooks, we directly compared logs to both observer data and landings receipts. Data were obtained from the NMFS Observer Program for all set gill net trips where an observer was present. We compared all trips where a GSB was observed, either kept or released, to the corresponding gill net logbook record and landing receipts.
Estimating Catch Per Unit Effort of GSB in the Set Gill Net Fishery
To estimate annual catch per unit effort (CPUE) of GSB in the set gill net fishery, we estimated the total number of set gill net trips and set gill net trips landing GSB using landing receipts from 1994–2022. We estimated total set gill net trips by counting unique date/captain/vessel/gear combinations by year, each indicating one day of landing (i.e., one trip) by a single individual. The number of trips where a GSB was landed was estimated the same way, since it is legal to retain only one GSB per gill net vessel, and landing receipts record pounds and not numbers of fish, the pounds landed were assumed to correspond to one GSB. Following this assumption, the estimated number of trips landing GSB is also the total estimated number of GSB landed. We calculated CPUE by dividing the estimated number of GSB caught by the estimated number of set gill net trips.
Potential Targeting of GSB in the Gill Net Fishery
To determine if gill net fishers may be targeting GSB, we examined the relative abundance of GSB landings occurring per gill net permit over ten years, 2012–2021, using landing receipt records. Using observer data, we assessed the proportion of individual’s trips where a GSB was caught, and compared this to the proportion of trips where target species California Halibut or White Seabass were caught. California Halibut were observed to be caught on 88% of trips where they were recorded as the target species, whereas White Seabass were caught on 65% of their targeted trips. The catch composition of 15 permit holders whose landings together comprised the majority, 82%, of GSB landings were assessed by calculating the relative proportion of each permittee’s total GSB catch to their total catch, total bycatch, and the total GSB landings for each year. Additionally, to identify if fishers could be targeting specific locations for GSB, using landing receipts, we determined the numbers and percentages of GSB caught by CDFW fishing block (10 x 10 nautical mi) compared to the catch locations for the most common fisheries that land GSB, California Halibut and White Seabass. Heat maps displaying areas of the most abundant landings were made using ArcMap v.10.6.
Results
Annual GSB Landings
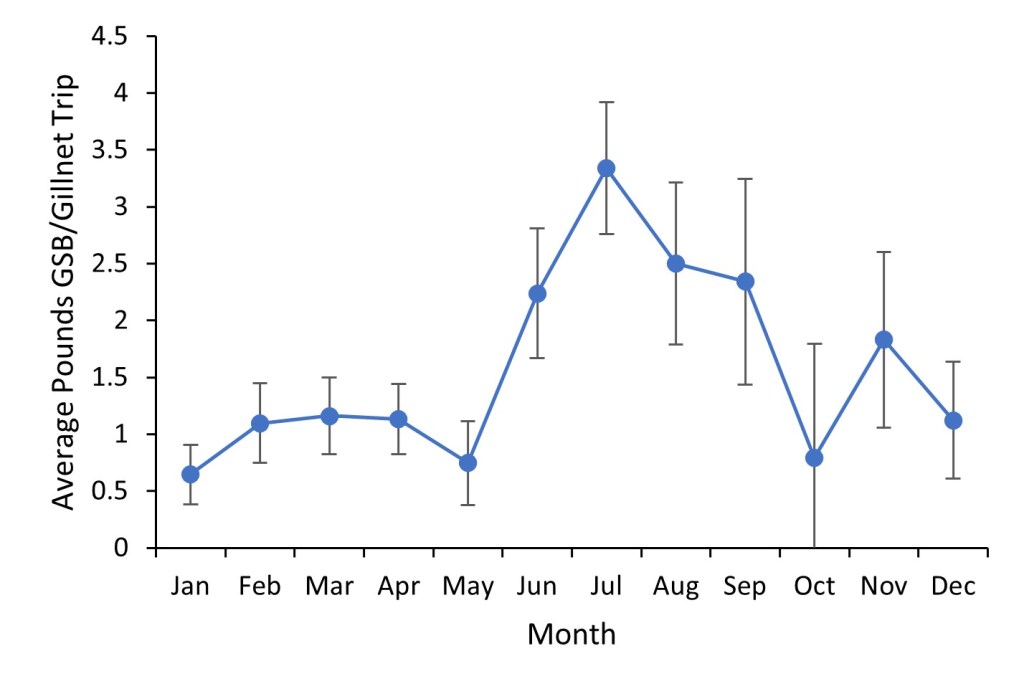
The commercial landings of GSB declined sharply in the mid-late 1960s. Since the closure of the directed fishery in 1981, the total amount of GSB retained decreased overall by 75% from 1981 to 2021 (Fig. 1). Prior to the closure of the fishery the majority of the GSB catch landed in California was caught in Mexico. From 1969–1981, 80% of the annual GSB landings on average were caught in Mexican waters. Since the closure of the fishery, GSB are still occasionally caught off Mexico, except only in the blocks that overlap both California and Mexican waters. Additionally, it can be seen with increasing protection in each time-period the annual GSB landings decrease (Table 1). The other/unknown gear type primarily consists of landing receipts where no gear type was recorded and also includes minimal amount of other net types that cannot legally land GSB. The illegal hook and line landings could be gear code errors but cannot be confirmed so they are listed as reported on landing receipts. The highest landings occurred prior to 1981 when GSB were not protected and were caught by all gear types. A sharp decrease is seen from 1981–1993 when GSB were protected and only allowed to be kept if incidentally caught in gill nets. A smaller further decline is observed from 1994 to the present when gill netting was banned in nearshore waters. Within years, monthly landings of GSB seasonally peak in the summer months. Catch per gill net trip was 2–3 times greater from June to September than most other months (Fig. 2). This peak in summer landings is consistent throughout all the time periods.
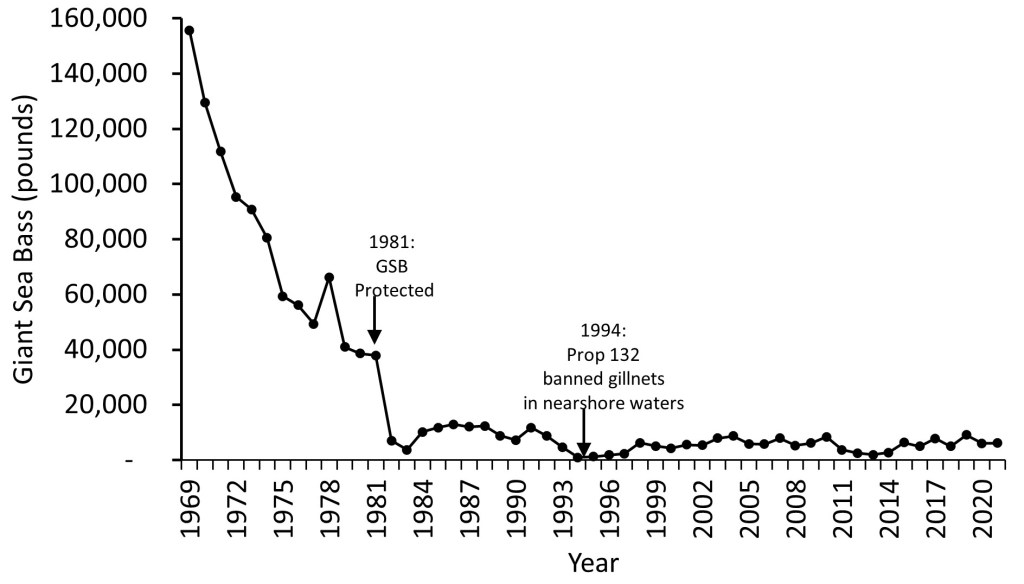
Table 1. Average pounds of Giant Sea Bass landed per year by gear type for each of three different time periods. Percentages of the total pounds landed are listed parenthetically and rounded to nearest single digit. See text for rationale of time periods.
| Gear Type | 1969–1980 | 1981–1993 | 1994–2021 |
| Set Gill Net | – | – | 4,665 (90%) |
| Drift Gill Net | – | – | 434 (8%) |
| Unspecified Gill Net | 23,264 (62%) | 5,142 (80%) | – |
| Hook and Line | 3,787 (5%) | 535 (5%) | 75 (1%) |
| Unknown/Other | 23,134 (29%) | 1,494 (13%) | 10 (<1%) |
| Trawl | 10 (<1%) | 23 (<1%) | 15 (<1%) |
| Average Total Pounds Landed/Year | 81,017 | 11,460 | 5,190 |
Lengths and Ages of GSB Caught in Gill Net Fishery
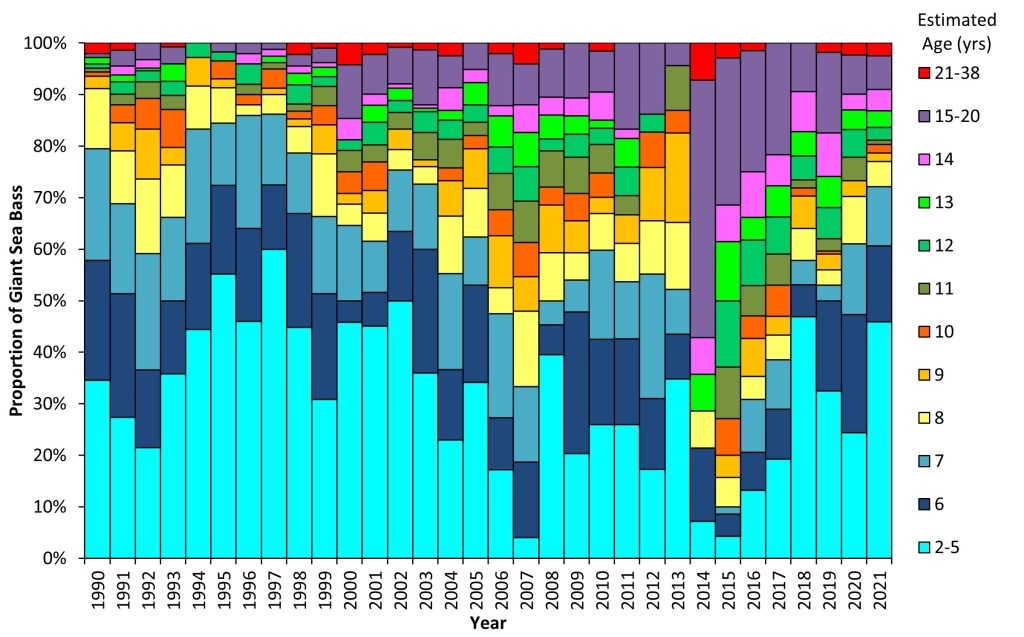
Weights from 3,359 GSB were converted to lengths (10–64 in; 25.4–162.5 cm) and ages (2–38 yrs). Sample sizes that comprise the age class groupings within a year range from 14–292 individuals with an average of 105. The majority (66%) of GSB landed in the gill net fishery from 1990–2013 are young fish approximately 2–7 years old (10–22 in; 25.4–55.9 cm) (Fig. 3). There is a general trend since 1990 of an increasing proportion of older GSB in the landings, with the largest amount of 15–20-year-olds from 2014–2017. The large shift from 2014–2017 could be due to larger individuals moving north during warm water events. Although 2014 is based on the smallest sample size of only 14 fish. Additionally, the largest proportion of 2–5-year-olds is seen from 1994–2002.
Accuracy of Fisher Reported Gill Net Logbooks
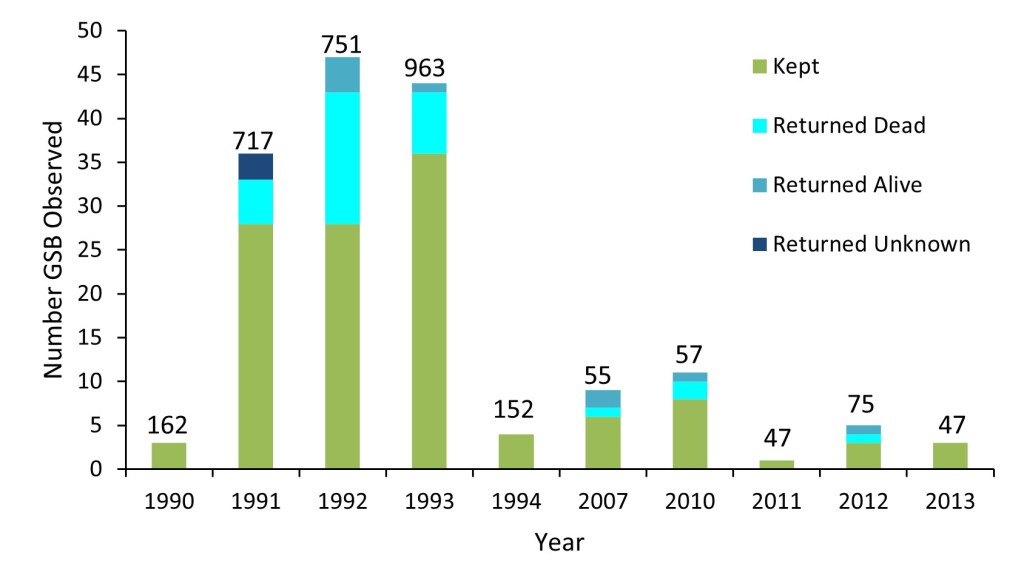
During the eleven years of observer program data from the set gill net fishery a total of 125 GSB were observed kept on 4% of trips and 43 GSB were observed discarded on 2% of trips. The majority, 72%, of the observer recorded GSB discards were returned dead. This is based on a small sample size of 31 GSB observed discarded dead from a total of 43 GSB discards from 1990–2017 (Fig. 4). In comparing each of these observer program occurrences of GSB to the gill net logbooks, none of the permittees reported any of the observed discards, whereas the majority (90%) of the GSB recorded as kept matched the gill net logs. This suggests the logbooks may be an accurate source for estimating the number of GSB kept but not for estimating the number released. On trips without an observer present, only eight permittees reported a total of 20 released GSB from 1980 to 2021. This shows released GSB are occasionally reported although not at a rate that makes the gill net logs reliable.
Estimating Catch Per Unit Effort of GSB in the Set Gill Net Fishery
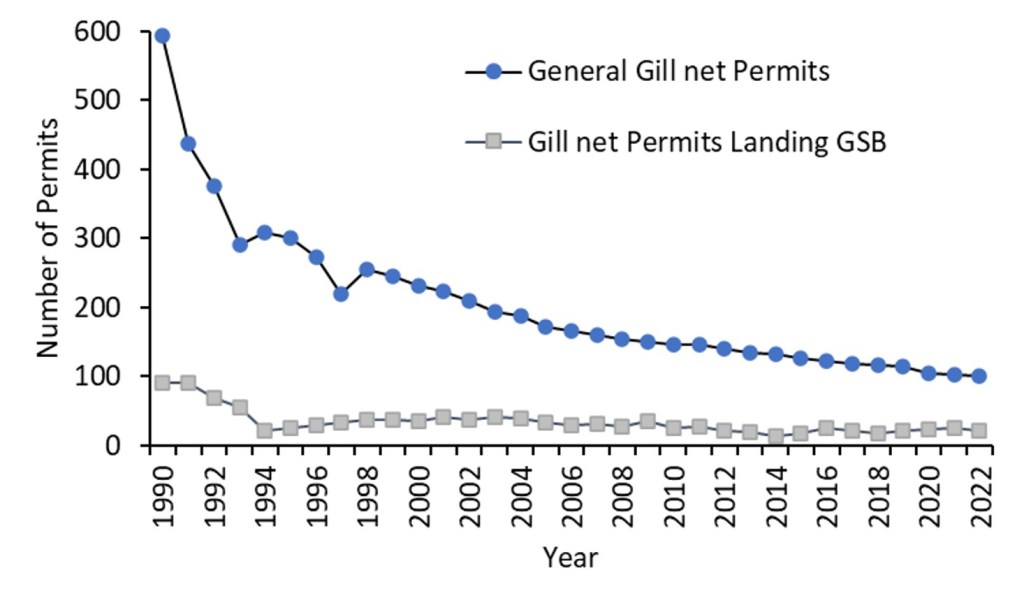
The estimated CPUE of GSB landed in the set gill net fishery has fluctuated since 1994. The CPUE ranges from the lowest point of 0.01 in 1994 to over ten times higher at 0.12 in 2022 (Fig. 5). The estimated number of total set gill net trips has decreased through time with the average number of annual gill net trips varying from 4,830 from 1994–2004 to 1,489 trips from 2012–2022.

Potential Targeting of GSB in the Gill Net Fishery
From 1994 to 2021, an average of 126 GSB were landed annually on only 4% of all gill net trips, well below the value that would indicate GSB are commonly targeted by the commercial fishery. The number of permittees responsible for the landings of GSB has decreased over time along with the total number of gill net permits sold, with an average of 17% of gill net permittees landing at least one GSB each year (Fig. 6).
From 2012 to 2021, 52,608 pounds (23,862 kg) of GSB were retained by 46 gill net permit holders, but the majority of the catch, 82%, came from 15 permittees. On average, an individual permittee caught GSB on 15% of their trips, which is well below the proportion of trips a target species was caught (California Halibut: 88%, White Seabass: 65%), indicating they are not targeting GSB. On average GSB ranked as the eighth most abundant species caught in their gill nets by weight.
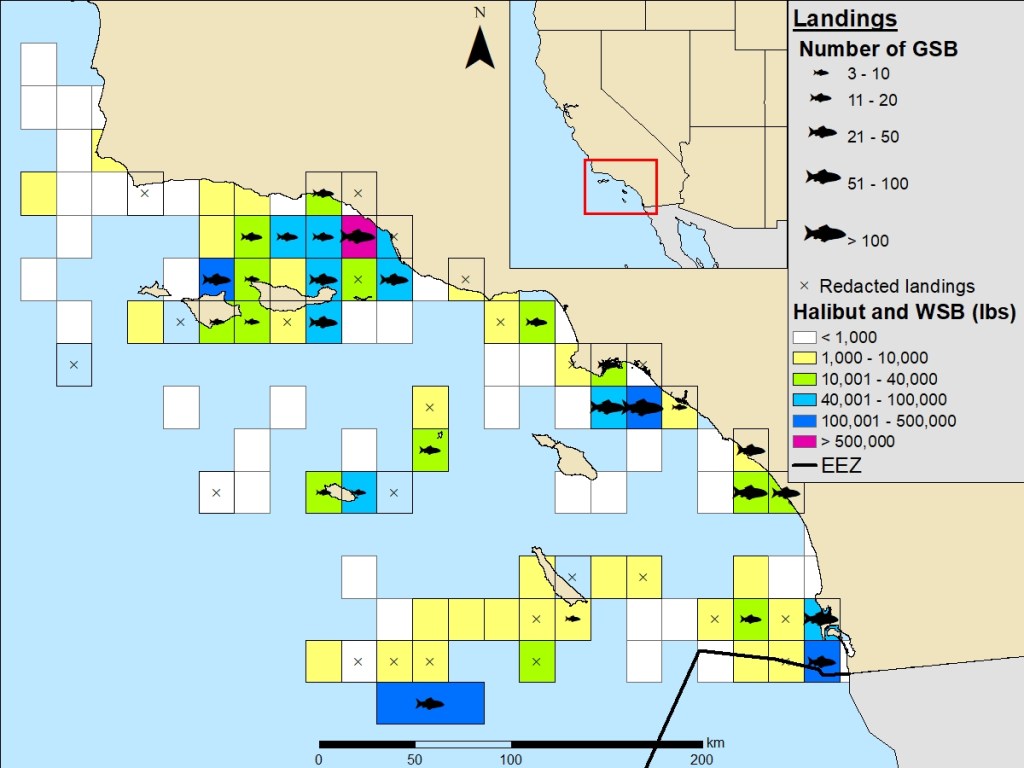
GSB were caught in numerous blocks which ranged considerably from the U.S.–Mexico border to San Luis Obispo County (Fig. 7). At least one GSB was caught in 60 unique blocks, but the majority, 72%, of GSB catch occurred across 10 blocks. These 10 blocks account for 36% and 31% of the White Seabass and California Halibut total set gill net landings, respectively. The primary location, off Huntington Beach, representing 26% of GSB landings, constitutes 8% of White Seabass, and 7% of California Halibut landings. Although, the White Seabass and California Halibut landings appear to be more spread out spanning 105 and 112 blocks, respectively. Additionally, there was no difference in the location of GSB landings from the top 15 permit holders compared to the rest of the gill net permittees who caught a GSB.
Discussion
The current management strategies in place appear to effectively protect GSB. Since GSB became protected in 1981, their landings have dramatically decreased, and have remained relatively stable since the implementation of Proposition 132 in 1994, which banned gill netting in nearshore waters (the primary habitat of GSB). There has been a decrease in the amount of set gill net effort, this can be seen with decreasing permit holders and decreasing number of annual set gill net trips. Despite the decrease in effort the number of GSB caught has not decreased in recent years which is seen with increasing CPUE. Along with the stability in GSB landings, there are multiple sources indicating their population has increased. There has been an increase in fishery independent GSB research (Benseman et al. 2019; Allen et al. 2020; Burns et al. 2020; Clevenstine and Lowe 2021), which may be facilitated by an increase in GSB abundance, as past numbers may have been too low to successfully conduct such research. From 1974 to 2001, GSB were not observed on SCUBA surveys off Palos Verdes but reappeared in 2002 and have continued to be observed (Pondella and Allen 2008). Similar surveys off Catalina Island had a 29-year absence of GSB until 1996 when they began to be observed again (Channel Island Research Program, unpub. data; House et al. 2016). CPUE from fishery independent nearshore gill net monitoring surveys also show an increase in GSB from 1995 to 2004 (Pondella and Allen 2008), and SCUBA surveys surrounding Catalina Island observed a return of multiple spawning aggregations (House et al. 2016). There have also been multiple sources of anecdotal evidence suggesting an increase in GSB sightings by recreational divers (Sahagun 2018), including a study suggesting the non-consumptive worth of GSB in the ecotourism industry has a much greater economic value than their consumptive worth from the commercial fishery (Guerra et al. 2017). While the GSB population seems to be on the rebound, there are some unknowns that make interpreting the full impact of fishing on GSB challenging.
Understanding the commercial catch of GSB is dependent on self-reported logbook data, in which the quality can be variable and difficult to measure (Sampson 2011). The compliance of recording discarded GSB is low when comparing self-reported gill net logbooks to observer data. Inaccurate reporting of bycatch is not an issue unique to GSB, as records of all non-target discarded species are low when compared to observer data. This points out the importance of fishery observers or electronic monitoring to capture these essential data. An accurate count of discarded GSB, along with more temporal coverage, would help in discerning impacts, especially since observer calculated mortality of released GSB is high at 72% and based on only 43 discards across 11 years. There is no evidence from the landings, logbook or observer data suggesting any of the permitted gill net permittees are specifically targeting GSB. Reporting suggests that all gill net permittees are landing GSB well below the proportion of trips where a target species was caught. The majority of the GSB landings in the past decade have come from a total of 15 permit holders (58% of active permit holders); however, GSB make up only ~2% of their total catch in pounds. The average price per pound of GSB has followed the same trend in fluctuations as target species and on average has been $1.29/lb less than California Halibut and $0.57/lb less than White Seabass. In combination with the protective regulations for GSB, this indicates there is not a significant financial incentive for permittees to target GSB over other legal fisheries species. The primary locations where GSB are landed are similar to California Halibut and White Seabass landings, suggesting permittees are targeting specific areas for more lucrative species and that GSB are the incidental catch of those fisheries.
In addition to the relative increase in GSB CPUE, there appears to be a change in age classes landed through time, with an increase in mature individuals (fish over 13 years) after 2000. The increase in older individuals could be from decreased fishing pressure allowing individuals to grow before being removed from the population. This change in age class also reflects fishery independent research, as the majority of GSB observed off Catalina were estimated to be over 15 years (House et al. 2016). Observations of a change in size structure in both the commercial fishery and independent surveys may alternatively reflect a small population, which is supported by research suggesting GSB are from a single genetically bottlenecked population (Chabot et al. 2015). The increase in older fish recently seems to be the result of the strong year classes of younger fish around 15 years ago. This may be due to strong recruitment events in the early 1990s, or due to larger fish coming up from Mexico during El Niño or warmer water conditions. There are limited studies on GSB age at maturity, with conflicting estimates of maturity between 7–8 years (Domeier 2001) and 11–13 (Fitch and Lavenberg 1971). Using either maturity estimate it appears the majority of GSB landings are immature fish. The size structure of gill net catch should continue to be monitored to understand changes in age structure and the potential impacts on GSB populations.
There are no current population estimates of GSB, but there is increasing evidence that their populations are slowly recovering based on multiple long-term SCUBA monitoring programs (Pondella and Allen 2008; House et al. 2016; Channel Island Research Program, unpub. data). Our GSB catch estimates support this and indicate a much larger population than suggested in fishery independent population estimates (Chabot et al. 2015; House et al. 2016). Guerra et al. (2017) uses the Chabot et al. (2015) population estimate of 500 individuals and landing receipt data to estimate 2–19% of the GSB population are taken by commercial fishing each year within southern California alone. Although if annual impacts were this high, the availability of GSB would decrease and likely be reflected in declining incidental catch and overall observations, which has not been the case. Another study also suggested the effective population estimate of 500 individuals and census estimate of <5000 individuals (Chabot et al. 2015) is certainly an underestimate, calculating that if these estimates were true, Mexico would be catching an unsustainable rate of 85% of the GSB population every year (Ramirez-Valdez et al. 2021). Our assessment did not include GSB landings in Mexico which are estimated 19 times higher than in California, and it would increase accuracy for further assessments of the GSB population to include impacts of the Mexican fishery as 73% of the GSB range occurs in Mexico (Ramirez-Valdez et al. 2021). Another unknown impact is potential catch and release mortality in the recreational fishery. Recreational fishing is popular in GSB habitats of kelp forests and nearshore rocky reefs, and although it is illegal for them to be kept, hook and line release mortality may impact GSB recovery especially if encounters rise with increasing populations.
In conclusion, despite the allowance of incidental GSB take in the gill net fishery, their population appears to be rebuilding. Even with the apparent continued increase in GSB since their protection, incidental gill net landings have not increased, which suggests there is less impact than previously thought. Many other large predatory fishes around the world whose populations have declined to low levels due to overfishing can rebound with proper management and protection (Sadovy et al. 2020). The Goliath Grouper whose population declined to near extinction in the 1970s is now increasing in abundance with reliable sightings in Florida’s dive tourism industry (Koenig et al. 2020). Despite the incidental gill net take of GSB, with the current levels of protection continued, it appears the GSB populations may continue to increase. Continued fishery-independent research including evaluation of catch and release mortality in the recreational fishery should be done to further track the recovery of GSB.
Acknowledgments
We would like to thank Armand Barilotti for creating the catch locations map, as well as reviewing and providing edits to earlier drafts of the manuscript. We thank Kirsten Ramey and Craig Shuman for their time reviewing the manuscript and providing constructive feedback. We would also like to thank the set gill net fishers for their time spent confirming landing records.
Literature Cited
- Allen, L. G., E. S. Ladin, and T. J. Rowell. 2020. Sound production and mechanism in the Giant Sea Bass, Stereolepis gigas (Polyprionidae). Copeia 108(4):809–814.
- Baldwin, D. S., and A. Keiser. 2008. Giant Sea Bass, Stereolepis gigas. Status of the fisheries. Report California Department of Fish and Game, 8 pp.
- Burns, E. S., A. J. Clevenstine, R. K. Logan, and C. G. Lowe. 2020. Evidence of artificial habitat use by a recovering marine predator in southern California. Journal of Fish Biology 97(6):1857–1860.
- Benseman, S. A., M. C. Couffer, and L. G. Allen. 2019. Behavior of young-of-the-year Giant Sea Bass, Stereolepis gigas, off the sandy beaches of southern California. Bulletin, Southern California Academy of Sciences 118(2):79–86.
- Chabot, C. L., H. A. Hawk, and L. G. Allen. 2015. Low contemporary effective population size detected in the critically endangered giant sea bass, Stereolepis gigas. Fisheries Research 172:71–78.
- Clevenstine, A. J., and C. G. Lowe. 2021. Aggregation site fidelity and movement patterns of the protected marine predator Giant Sea Bass (Stereolepis gigas). Environmental Biology of Fishes 104(4):401–417.
- Domeier, M. 2001. Giant Sea Bass. Pages 209–211 in W. S. Leet, C. M. Dewees, R. Klingbeil, and E. J. Larson, editors. California’s Marine Living Resources: A Status Report. California Department of Fish and Game, Sacramento, CA, USA.
- Fitch, J. E., and R. N. Lavenberg. 1971. California Marine Food and Game Fishes. California Natural History Guides #28. University of California Press, Berkeley, CA, USA.
- Guerra, A. S., D. J. Madigan, M. S. Love, and D. J. McCauley. 2017. The worth of giants: the consumptive and non-consumptive use value of the Giant Sea Bass (Stereolepis gigas). Aquatic Conservation: Marine and Freshwater Ecosystems 28(2):1–9.
- Hawk, H. A., and L. G. Allen. 2014. Age and growth of Giant Sea Bass, Stereolepis gigas. California Cooperative Oceanic Fisheries Investigations Report 55:128–134.
- House, P. H., B. L. F. Clark, and L. G. Allen. 2016. The return of the king of the kelp forest: distribution, abundance, and biomass of Giant Sea Bass (Stereolepis gigas) off Santa Catalina Island, California, 2014–2015. Bulletin, Southern California Academy of Sciences 115(1):1–14.
- Horn, M. H., and L. A. Ferry-Graham. 2006. Feeding mechanisms and trophic interactions. Pages 387–410 in L. G. Allen, D. J. Pondella, II, and M. H. Horn, editors. The Ecology of Marine Fishes: California and Adjacent Waters. University of California Press, Berkeley, CA, USA.
- Koenig, C. C., F. C. Coleman, and C. R. Malinowski. 2020. Atlantic Goliath Grouper of Florida: to fish or not to fish. Fisheries 45(1):20–32.
- Love, M. S., and J. K. Passarelli, editors. 2020. Miller and Lea’s guide to the coastal marine fishes of California. 2nd edition. University of California, Agriculture and Natural Resources, Davis, CA, USA.
- Pondella, D .J., II and L. G. Allen. 2008. The decline and recovery of four predatory fishes from the Southern California Bight. Marine Biology 154:307–313.
- Ramirez-Valdez, A., T. J. Rowell, K. E. Dale, M. Craig, L. G. Allen, J. C. Villasenor-Derbez, A. M. Cisneros-Montemayor, A. Hernandez-Velasco, J. Torre, J. Hofmeister, and B. E. Erisman. 2021. Asymmetry across international borders: research, fishery and management trends, and economic value of the giant sea bass (Stereolepis gigas). Fish and Fisheries 22(6):1392–1411.
- Sadovy de Mitcheson, Y. J., C. Linardich, J. P. Barreiros, G. M. Ralph, A. Aguilar-Perera, P. Afonso, B. E. Erisman, D. A. Pollard, S. T. Fennesyy, A. A. Bertoncini, R. J. Nair, K. L. Rhodes, P. Francour, T. Brulé, M. A. Samoilys, B. P. Ferreira, and M. T. Craig. 2020. Valuable but vulnerable: over-fishing and under-management continue to threaten groupers so what now? Marine Policy 116:103909.
- Sahaguan, L. 2018. Giant sea bass are mysterious to scientists. Understanding them could help the species survive. Times, Los Angeles, 1–12.
- Sampson, D. B. 2011. The accuracy of self-reported fisheries data: Oregon trawl logbook fishing locations and retained catches. Fisheries research, 112(1-2), 59-76.
- Williams, C. M., J. P. Williams, J. T. Claisse, D. J Pondella, and M. L. Domeier. 2013. Morphometric relationships of marine fishes common to central California and the Southern California Bight. Bulletin, Southern California Academy of Sciences 112(3):217–227.