

FULL RESEARCH ARTICLE
William Tim Bean1*, Alyssa Semerdjian2, Ian Axsom3, and Jennifer Ibarra1
1 California Polytechnic State University, Biological Sciences Department, San Luis Obispo, 1 Grand Avenue, San Luis Obispo, CA 93407, USA https://orcid.org/0000-0001-6595-5885 (WTB)
2 California Polytechnic State University, Humboldt, Vertebrate Museum, 1 Harpst Street, Arcata, CA 95521, USA https://orcid.org/0009-0007-7818-3547
3 Sequoia Riverlands Trust, 427 South Garden Street, Visalia, CA 93277, USA https://orcid.org/0009-0003-5745-5989
*Corresponding Author: wtbean@calpoly.edu
Published 8 October 2026 • doi.org/10.51492/cfwj.112.10
Abstract
Estimating occupancy is a key demographic variable for wildlife managers. While passive recorders such as camera traps or acoustic recording units have become a standard tool for estimating occupancy, many species cannot be reliably identified with these tools. For most rodents, live trapping remains the gold standard for determining occupancy, but this practice is invasive and expensive, and alternate tools are needed. Giant kangaroo rats (Dipodomys ingens), a federally and California-listed endangered species, produce distinct burrow mounds and associated signs that have long been used to infer presence or absence, but reliability of these signs has not been systematically evaluated. We tested whether a standardized checklist of field signs could accurately predict giant kangaroo rat occupancy across their range in central California. We recorded 18 binary indicators of activity in 355 unique site/year combinations in the summers of 2016, 2017, 2024, and 2025, then used live trapping to independently estimate presence or absence. We trained an XGBoost model to predict occupancy from the sign data. The model showed excellent predictive performance, with an area under the curve (AUC) of 0.98. Using an optimal classification threshold of 0.63, the model correctly classified 95% of testing sites, with sensitivity of 0.94 and specificity of 0.96. Dust baths, pit caches, and large burrow mounds were the strongest predictors of occupancy, whereas undisturbed loose dirt, tracks or trail drags, and runways contributed least to the model. Our results demonstrate that a standardized, sign-based survey can provide a highly accurate, non-invasive method for estimating giant kangaroo rat occupancy. Formalizing field sign interpretation with machine learning offers a transparent and scalable approach for monitoring this endangered ecosystem engineer and may be broadly applicable to other species for which characteristic signs indicate presence.
Key words: animal sign, Dipodomys ingens, endangered species, habitat assessment, machine learning, wildlife monitoring
| Citation: Bean, W. T., A. Semerdjian, I. Axsom, and J. Ibarra. 2026. A non-invasive sign survey for determining giant kangaroo rat presence. California Fish and Wildlife Journal 112:e10. |
| Editor: Kate Morozova, Habitat Conservation Planning Branch |
| Submitted: 3 April 2026; Accepted: 22 May 2026 |
| Copyright: ©2026, Bean et al. This is an open access article and is considered public domain. Users have the right to read, download, copy, distribute, print, search, or link to the full texts of articles in this journal, crawl them for indexing, pass them as data to software, or use them for any other lawful purpose, provided the authors and the California Department of Fish and Wildlife are acknowledged. |
| Competing Interests: The authors have not declared any competing interests. |
Introduction
Determining species’ presence or absence is a key tool for wildlife management and conservation. Although occupancy (“the proportion of sample units that is occupied” [MacKenzie et al. 2017]) does not provide the same depth of information as estimates of population demographics, it can generally be estimated with substantially less field effort (Noon et al. 2012). For many management objectives, the benefits of obtaining broad-scale estimates of occupancy outweigh the additional information gained from capture–recapture studies or other estimates of density or survival at smaller scales (Noon et al. 2012). As a result, wildlife ecologists have developed a suite of robust methods for estimating this important parameter.
Because presence/absence estimates require identification only to the species level, a variety of passive sampling methods are now widely used, including track stations (Ray and Zielinski 2012), camera traps (Burton et al. 2015), and passive acoustic monitors (Shonfield and Bayne 2017). However, many of these approaches require expensive analyses and intensive data processing, and—more important—numerous taxa cannot be reliably identified to species using these techniques. Rodents, for example, are generally not detectable with passive acoustic monitoring and are often identifiable only to the family or genus level using track plates or camera traps (Boynton et al. 2021).
The use of animal sign as an indicator of presence has a long history in wildlife management as a relatively inexpensive and non-invasive alternative to other methods (Gese 2001). Tracks, scat, vegetation clipping, tree damage, and animal engineering have all been used to detect recent occupancy at the species level across a wide range of mammalian taxa (Cotner and Schooley 2011; Ngoprasert et al. 2011; Sunarto et al. 2012). These approaches, however, must be applied with caution, as they often require substantially greater expertise than is commonly acknowledged (Wharton 2006). Ideally, methods for determining presence should be inexpensive, non-invasive, reliable, and straightforward to implement. Sign-based presence surveys should be tested with species of management interest that make distinct and consistent signs.
Giant kangaroo rats (Dipodomys ingens) are a federally and California-listed endangered species and an important ecosystem engineer (Prugh and Brashares 2012). They strongly impact other species in the community that they occupy through burrowing, herbivory and zoochory. Reliable estimates of giant kangaroo rat presence are critical for guiding habitat management, assessing population trends, and prioritizing conservation actions across their fragmented range. Giant kangaroo rats construct extensive burrow systems with mounded soils, sometimes referred to as “precincts.” Over time (≥10 years [Semerdjian et al. 2021]), these precincts develop vegetation patches that are distinct from the surrounding environment and sometimes develop large mounds that are visible from the ground or air. Each year as the dry season progresses, giant kangaroo rats clip all standing vegetation from the tops of their burrow mounds, creating distinctive circular patches of bare soil embedded within a matrix of grasses and forbs. Wildlife managers have used the presence of vegetation clipping on burrow mounds during aerial surveys to estimate the extent of giant kangaroo rat presence in the Carrizo Plain National Monument (San Luis Obispo County, CA) and elsewhere within the species’ extant range (Bean et al. 2012b; Semerdjian et al. 2021). However, crewed aerial surveys are expensive, require both a licensed pilot and a trained observer, and typically achieve spatial precision no finer than approximately 500 m. Uncrewed aerial surveys offer better spatial precision, but also require a licensed and trained vehicle (drone) pilot, and each flight can only occur within the pilot’s unassisted line of sight, making it time consuming and logistically difficult to survey large areas.
Researchers and wildlife managers have also relied on ground-based sign surveys to estimate giant kangaroo rat occupancy (Semerdjian 2019; Williams et al. 1995). Burrow mounds are sufficiently distinctive that even limited field experience appears adequate for a field technician to distinguish them from other landforms. However, burrow mounds can persist for many years following local extirpation (Semerdjian et al. 2021), meaning their presence alone does not indicate current occupation. Surveyors therefore rely on additional signs of activity, including tail drags, large hind footprints, fecal pellets, unobstructed burrow entrances, and characteristic seed “haypiles” or “haystacks” left to cure prior to caching. To estimate presence, field biologists assess these signs holistically to determine whether a burrow system is active. To our knowledge, however, no systematic evaluation has tested which combination of signs most reliably predict giant kangaroo rat occupancy.
In this study we sought to systematically evaluate giant kangaroo rat signs and evaluate their strength and weakness for determining presence. We recorded eighteen signs of giant kangaroo rat activity at sites throughout the species’ range over four years between 2016 and 2025. Following sign surveys, we conducted live trapping to confirm presence or absence of the species. We then developed a machine-learning model to predict trapping outcomes based on the sign data. Our objective was to evaluate whether a standardized checklist of field signs could reliably predict giant kangaroo rat presence or absence.
Methods
All work performed in this study was conducted following protocols with approval by the Humboldt State University (#16-17.W.96-A) and Cal Poly – San Luis Obispo Animal Care and Use Committees (#2303), a Memorandum of Understanding and Scientific Collecting Permit from California Department of Fish & Wildlife (SC-011135 and S-190910002-19091-001), and an Endangered Species Recovery Permit from U.S. Fish & Wildlife Service (TE37418A-3 and ESPER0003728).
Data Collection
We conducted sign surveys and giant kangaroo rat trapping during the summers of 2016, 2017, 2024, and 2025 (Fig. 1). Summer is an optimal period for these surveys because giant kangaroo rats are most active during this season and produce characteristic haypiles. Sites were selected using a stratified random design developed in an earlier study in the Carrizo Plain National Monument (Bean et al. 2014). Locations were stratified along a gradient of giant kangaroo rat habitat suitability, with points distributed equally among 10 bins of suitability between 0 and 1. However, sites in 2016 and 2017 were selected primarily to update knowledge of giant kangaroo rat occupancy in understudied parts of the species’ range and while we sampled from a range of suitability values, these sites were not systematically stratified. In 2024 and 2025, we further subset sites where giant kangaroo rats were expected to be absent, as the 2016–2017 surveys contained a disproportionate number of occupied sites.

The sign survey consisted of 18 binary indicators expected to be associated with giant kangaroo rat presence (Table 1). Previous work (Semerdjian 2019) defined slightly different coding for the final six indicators, in which positive values represented hypothesized negative relationships with giant kangaroo rat presence. For clarity and consistency, we reversed these codes so that a value of 1 consistently indicated an expected association with giant kangaroo rat presence, whereas a value of 0 indicated expected absence. For example, the original code “unbroken spider webs” (associated with inactive burrows) was switched to “no unbroken spider webs.”
Table 1. Signs used to survey for giant kangaroo rats and their descriptions
| Code | Sign | Description |
| A | Herbaceous clipping | Vegetation at survey point is clipped within 5–10cm of ground |
| B | Haystacks | Piles 10–200 cm in diameter of seeds and grass stalks on bare ground |
| C | Fresh apron | Pile of fresh dirt splayed out of a burrow entrance |
| D | Tracks/tail drags | Kangaroo rat tracks include oblong parallel imprints from hind feet, may or may not include lines in the dirt from tails dragging |
| E | Dust baths | Fresh loose dirt with concave imprint indicating recent dust bath |
| F | Pit caches | Tablespoon size round imprints for seed storage; often several in close proximity, can cover the majority of bare dirt around precinct |
| G | Scats | Smooth, hard, slightly crescent shaped oblong fecal pellets measuring at least 1.5×5 mm |
| H | Runways | Narrow trails in the grass connecting burrows or precincts |
| I | Miscellaneous digging | Signs of digging that do not fall into other listed categories |
| J | Large mound with burrows | Raised earth with one to several burrow entrances |
| K | Newly backfilled burrows | Burrow with fresh (relatively dark and damp) loose dirt blocking the entrance |
| L | Less vegetation on precinct | Survey area has more bare ground than surrounding area |
| M | Holes not obstructed by dirt or rocks | Burrow lacks rocks or dirt that partially or fully obstruct entrance |
| N | Hole entrances not filled with plant matter | Burrow entrance has been cleared of plant matter |
| O | No unbroken spiderwebs | Burrow has no unbroken spider webs in entrance |
| P | Herbaceous veg on precinct < surrounding | Survey point has less herbaceous vegetation than surrounding area |
| Q | Undisturbed loose dirt | Soft loose dirt at survey point, some tracks, or signs of recent digging |
| R | Any holes/precincts | Survey point has holes or a precinct |
Because the objectives of the 2016–2017 surveys differed from those of the 2024–2025 surveys, the definition of a “site” and the associated data collection methods also differed. The earlier surveys were designed primarily to identify novel or understudied giant kangaroo rat habitat, and site boundaries therefore varied by location. In some cases, a site encompassed an entire property; in others, properties were subdivided into multiple survey locations. Two trained observers searched each survey location on foot for evidence of giant kangaroo rat burrow mounds before selecting a focal trapping location. Then, at a location they felt was most likely to support giant kangaroo rats, they set out a 3 x 5 trapping grid with 20 m spacing. Sign surveys were recorded at each trap location prior to trapping.
We conducted the later surveys (2024–2025) specifically to evaluate the performance of the sign survey. In these surveys, we defined sites as circular areas with a 25-m radius centered on each sampling point. Sign codes A–I were assessed at the site level, after which a single representative burrow mound was selected to evaluate codes J–R. If no giant kangaroo rat burrow mounds were present, the field crew evaluated an available small mammal burrow.
We also applied the sign survey to plots within the Carrizo Plain Ecosystem Project (Prugh and Brashares 2012). These plots were trapped annually to estimate giant kangaroo rat abundance and survival in a mark-recapture framework, with an 11 x 11 checkerboard grid at 10-m spacing. We assessed signs using protocols consistent with the 2024–2025 surveys: codes A–I were evaluated at the plot level, and codes J–R were evaluated at a representative burrow mound.
Following completion of sign surveys, we conducted live trapping to determine giant kangaroo rat occurrence. We used Sherman XL live traps baited with white millet. Traps were opened at sunset and checked approximately 2–4 hours later. All sites were trapped for three consecutive nights. Previous work indicated that five traps deployed for three nights in similar habitat would achieve 95% detection probability (Bean et al. 2012b); therefore, we expected that both the 2016–2017 (fifteen traps for three nights) and the 2024–2025 (five traps for three nights) would both achieve high detection probability (>0.95 per session).
For analysis, we treated each site-year combination as an independent observation of giant kangaroo rat presence or absence. We classified a site as occupied if at least one giant kangaroo rat was captured in any trap during that survey. In 2024–2025, we evaluated signs directly at the site level following a standardized protocol. To ensure consistency across years, we aggregated trap-level sign data collected in 2016–2017 to generate site-level measures comparable to those from the later surveys. Specifically, for the first signs A–I, a site was recorded having a sign present if it was observed in any trap-level survey at that site. For signs J–R, we identified the trap-level survey with the highest summed sign score and used that survey to represent the site. This approach was intended to replicate the 2024–2025 protocol, in which signs A–I were assessed across the site as a whole, while signs J–R were recorded at a single representative burrow.
Data Analysis
We used a machine-learning model to combine the 18 recorded signs at each survey location and predict giant kangaroo rat presence/absence as a binary response variable. Specifically, we implemented XGBoost, a gradient tree-boosting approach that often outperforms other machine-learning methods, particularly when predictor variables are binary (e.g., presence or absence of haypiles; Chen and Guestrin 2016; Mienye and Sun 2022; Miller et al. 2023). In general, decision trees are a class of machine learning methods that generate a rule-based model to predict a response variable from a set of predictors. This approach is robust to non-linearity and collinearity among model predictors; preliminary analysis using the 2016–2017 data suggested that simpler approaches (e.g., logistic regression) would not handle these interactions as well. Boosted trees improve on this approach by generating a large number of shallow trees in sequence, with each new tree focusing on regions where previous models performed poorly, resulting in low bias and high predictive accuracy (Pichler and Hartig 2023). Models were implemented in R (4.5.3) using the xgboost package (Chen et al. 2014). We specified a binary logistic objective function with log loss (“logloss”) as the evaluation metric. Model hyperparameters included a learning rate (“eta”) of 0.05, a maximum tree depth of 3 to limit overfitting, a subsampling rate of 0.9, and a minimum child weight of 1. To understand which features most impacted model performance, we used Shapley Additive Explanations (SHAP, [Lundberg and Lee 2017; Just et al. 2020]) using the SHAPforxgboost package in R (Liu and Just 2020).
To evaluate model performance, we randomly split the sites into training (80%) and testing (20%) datasets. We used the trained model to predict the probability of giant kangaroo rat presence at testing sites and assessed model performance using multiple accuracy metrics, including the threshold-independent Area Under the Curve (AUC). We then selected a probability threshold to convert continuous predictions into binary “present” or “absent” classifications. Threshold selection followed a two-step criterion: first, we identified thresholds for which both sensitivity (i.e., true positive rate) and specificity (true negative rate) were both ≥0.94, if possible; second, among those thresholds, we selected the value that maximized the sum of sensitivity and specificity (Bean et al. 2012a). Using this optimal threshold, we calculated overall classification accuracy as well as sensitivity and specificity.
Results
Data Collection
We surveyed 355 sites across four years (N2016 = 114, N2017 = 131, N2024 = 66, N2025 = 44). Giant kangaroo rats were detected via live-trapping at 231 (65.1%) of the sites. The most frequently observed signs of activity were “Runways,” “Scats,” and “Miscellaneous digging” (Table 2).
Table 2. Summary of giant kangaroo rat-related signs observed by count and percentage of sites, 2016–2017 and 2024–2025, central California. Count of GKR Present represents the number of sites giant kangaroo rats were detected in traps (out of the 231 total sites where they were found) when the listed sign was also present.
| Sign | Count | Percent | GKR Present |
| Runways | 341 | 96.1% | 226 |
| Scats | 324 | 91.3% | 227 |
| Miscellaneous digging | 317 | 89.3% | 220 |
| Tracks / tail drags | 305 | 85.9% | 225 |
| Pit caches | 294 | 82.8% | 215 |
| Herbaceous clipping | 272 | 76.6% | 211 |
| Holes not obstructed by dirt or rocks | 261 | 73.5% | 186 |
| Less vegetation on precinct | 249 | 70.1% | 172 |
| Dust baths | 221 | 62.3% | 193 |
| Hole entrances not filled with plant matter | 218 | 61.4% | 147 |
| Fresh apron | 217 | 61.1% | 152 |
| No unbroken spiderwebs | 162 | 45.6% | 106 |
| Newly backfilled burrows | 150 | 42.3% | 120 |
| Haystacks | 146 | 41.1% | 119 |
| Any holes/precincts | 126 | 35.5% | 73 |
| Large mound with burrows | 125 | 35.2% | 101 |
| Undisturbed loose dirt | 61 | 17.2% | 38 |
| Herbaceous veg on precinct < surrounding | 58 | 16.3% | 37 |
Data Analysis
The boosted regression tree model incorporating all 18 signs exhibited excellent predictive performance. The area under the receiver operating characteristic curve (AUC), a threshold-independent metric of accuracy, was 0.98. The optimal probability threshold for classifying presence or absence was 0.63, selected to maximize the sum of sensitivity and specificity while ensuring both values were ≥0.94. At this threshold, the model correctly classified (PCC) 95% of the reserved testing sites; sensitivity was 0.94 and specificity was 0.96.
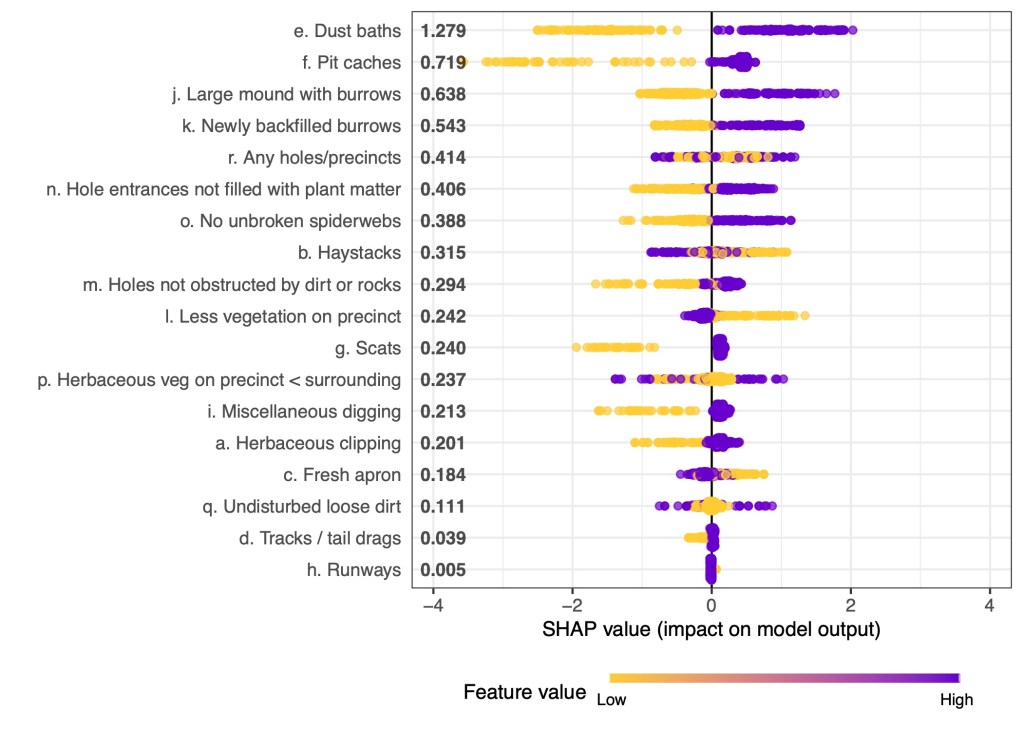
Among the 18 signs evaluated, “dust baths,” “pit caches,” and “large mound with burrows” were the strongest predictors of giant kangaroo rat presence or absence, whereas “undisturbed loose dirt,” “tracks or tail drags,” and “runways” contributed the least to model predictions (Fig. 2).
When applied to all surveyed sites, the model produced clear separation between occupied and unoccupied locations (Fig. 3). Median predicted probability of presence was 0.969 at sites where giant kangaroo rats were detected by trapping, compared to 0.074 at sites where the species was not detected (Fig. 4).


Discussion
We developed a machine learning model that predicts giant kangaroo rat presence using a non-invasive survey of 18 field signs, and the model achieved very high predictive accuracy. Specifically, it correctly classified 95% of sites withheld from model training. Sensitivity—the proportion of occupied sites correctly identified as present—was 0.94, a value comparable to detection probabilities reported for three-night, five-trap live-trapping designs (Bean et al. 2012b). This level of performance matches or exceeds commonly used targets in ecological monitoring studies, which range from 0.8 (Falaschi et al. 2022) to 0.9 (Shannon et al. 2014) and more typically approach 0.95 (e.g., Green and Young 1993; Olea and Mateo-Tomás 2011).
This level of accuracy is perhaps unsurprising given the distinctive nature of “classic” giant kangaroo rat habitat as recognized by experienced field biologists. Large circular mounds with multiple burrow entrances and aprons of freshly excavated soil, clipped vegetation with seeds piled into haystacks, surface seed caches, and conspicuous large footprints and tail drags are all commonly associated with presence. These signs have long been used qualitatively to assess giant kangaroo rat occurrences (Shaw 1934; Williams and Kilburn 1991; Williams et al. 1995). Our approach formalizes this expert knowledge by quantifying and combining multiple signs into an objective and repeatable estimate of presence.
Importantly, not all characteristic signs were present at every occupied site. Large burrow mounds were observed at only 101 of the 231 sites (43.7%) where giant kangaroo rats were detected by trapping, while haystacks and pit caches were present at 119 (51.5%) and 215 (93.1%) of occupied sites, respectively. These discrepancies may reflect observer error, seasonal variation (e.g., haystacks are only constructed during certain summer months), or ecological differences among sites. In some portions of the species’ range, giant kangaroo rats do not construct the typical large, rounded mounds (Grinnell 1932), potentially due to soil conditions or recent colonization (Semerdjian et al. 2021).
Conversely, several signs commonly associated with presence were also observed at sites where giant kangaroo rats were not detected by trapping. Haystacks occurred at 27 (21.8%) unoccupied sites, and pit caches were observed at 79 (63.7%) such sites. It is possible that giant kangaroo rats were present but not captured at a small subset of these sites. In other cases, individuals may have died after constructing the haystacks or pit caches but before trapping occurred. Additionally, other kangaroo rat species, including Heermann’s kangaroo rats (Dipodomys heermanni), are reported to construct small piles of seeds similar to the haystacks that giant kangaroo rats produce; however, these are often much smaller and less robust (R. Stafford, pers. comm.). This overlap highlights the limitations of relying on individual signs in isolation and underscores the value of integrating multiple indicators when inferring presence or absence.
Live-trapping data, while often treated as a definitive estimate of presence, may itself provide a misleading picture of giant kangaroo rat habitat (Semerdjian et al. 2021). Individuals may be captured at sites that function as demographic sinks or during transient dispersal events, rather than reflecting long-term persistence. In contrast, the collective presence of burrow mounds, haystacks, and pit caches may better indicate sustained occurrence over time than the detection of a single individual in a trap. In such cases, the sign-based model may more accurately reflect habitat suitability than trapping data alone. Given the decreased cost, repeated sign surveys over multiple years may be less expensive than a single year of trapping. Conversely, as populations recover and reoccupy areas from which they were previously extirpated, trapping may serve as an early indicator of recolonization that precedes the development of burrow mounds and other engineered features. In either case, locations where the model and trapping disagree may provide important insight into giant kangaroo rat demography and recovery.
This study relied on data from two independent research efforts using different sampling designs. This included slightly different definitions of site boundaries, as well as combining multiple assessments of signs into a single observation in the earlier data collection period. However, there was no difference in model performance across the time periods: percent correctly classified, sensitivity, and specificity were all >0.95 for each time period (2016–2017 and 2024–2025).
Most of our study sites occurred within core giant kangaroo rat habitat, where the species typically dominates smaller-bodied rodents, including congeneric species. Future work should evaluate the model’s ability to discriminate giant kangaroo rat presence in areas of greater sympatry with other Dipodomys species. Improved understanding of the timing and seasonal development of haystacks and pit caches could also inform optimal survey timing. Although our results suggest that the model was relatively robust to such phenological variation in spring and summer, we did not test this method at any sites between October and March. Additionally, many researchers familiar with giant kangaroo rat burrow mounds target the vertical burrows (sometimes referred to as “chimneys”) as evidence of species presence. We did not include this in our checklist of signs, but doing so would likely improve accuracy. Finally, count data for some signs (e.g., number of haystacks, proportion of active burrows), or additional predictors (e.g., season, region) may similarly improve model performance.
Wildlife monitoring is currently undergoing rapid transformation driven by advances in machine learning and deep learning, enabling increasingly sophisticated passive sampling approaches using acoustic recorders (Kahl et al. 2021) and camera traps (Ahumada et al. 2020). In contrast, relatively few studies have applied these techniques to animal sign data. The model presented here achieved an estimated classification accuracy exceeding 95%, comparable to or exceeding performance reported in related applications. For example, Lonsinger et al. (2015) used machine-learning methods to distinguish coyote and kit fox scats based on morphometrics, with correct classification rates of 85–92% depending on method and season, representing a substantial improvement over earlier discriminant function analysis. Similarly, although not strictly a machine-learning approach, Goldman et al. (2023) integrated haypiles and other pika signs to improve occupancy models, achieving correct detection rates of 88–97%.
We suggest that wildlife managers who rely on animal sign to infer presence in other species consider developing similar predictive frameworks. By formalizing expert judgment into quantitative models, sign-based machine-learning approaches can provide standardized, transparent, and scalable tools for monitoring species of conservation concern across large spatial extents.
Acknowledgments
The authors would like to acknowledge J. Hurl, R. Namitz, B. Doran, H. Waite, E. Virnig, K. Silva, M. Seronello, J. Lederer, L. Crook, N. Merrifield, K. Garcia Lopez, M. Bunchongchitr, I. Widick, and S. Appleby.
Literature Cited
- Ahumada, J. A., E. Fegraus, T. Birch, N. Flores, R. Kays, T. G. O’Brien, J. Palmer, S. Schuttler, J. Y. Zhao, W. Jetz, M. Kinnaird, S. Kulkarni, A. Lyet, D. Thau, M. Duong, R. Oliver, and A. Dancer. 2020. Wildlife Insights: a platform to maximize the potential of camera trap and other passive sensor wildlife data for the planet. Environmental Conservation 47:1–6.
- Bean, W. T., L. R. Prugh, R. Stafford, H. S. Butterfield, M. Westphal, and J. S. Brashares. 2014. Species distribution models of an endangered rodent offer conflicting measures of habitat quality at multiple scales. Journal of Applied Ecology 51:1116–1125.
- Bean, W. T., R. Stafford, and J. S. Brashares. 2012a. The effects of small sample size and sample bias on threshold selection and accuracy assessment of species distribution models. Ecography 35:250–258.
- Bean, W. T., R. Stafford, L. R. Prugh, H. Scott Butterfield, and J. S. Brashares. 2012b. An evaluation of monitoring methods for the endangered giant kangaroo rat. Wildlife Society Bulletin 36:587–593.
- Boynton, M. K., M. Toenies, N. Cornelius, and L. Rich. 2021. Comparing camera traps and visual encounter surveys for monitoring small animals. California Fish and Wildlife Journal 107:99–117.
- Burton, A. C., E. Neilson, D. Moreira, A. Ladle, R. Steenweg, J. T. Fisher, E. Bayne, and S. Boutin. 2015. Wildlife camera trapping: a review and recommendations for linking surveys to ecological processes. Journal of Applied Ecology 52:675–685.
- Chen, T., and C. Guestrin. 2016. XGBoost: A scalable tree boosting system. Page 785–794 in B. Krishnapuram, M. Shah, A. Smola, C. Aggarwal, D. Shen, and R. Rastogi, chairs. Proceedings of the 22nd ACM SIGKDD International Conference on Knowledge Discovery and Data Mining. Association for Computing Machinery, New York, NY, USA. https://doi.org/10.1145/2939672
- Chen, T., T. He, M. Benesty, V. Khotilovich, Y. Tang, H. Cho, K. Chen, R. Mitchell, I. Cano, T. Zhou, M. Li, J. Xie, M. Lin, Y. Geng, Y. Li, J. Yuan, and D. Cortes. 2014. Xgboost: Extreme gradient boosting. Version 3.2.1.1. Comprehensive R Archive Network, Vienna, Austria. https://cran.r-project.org/package=xgboost
- Cotner, L. A., and R. L. Schooley. 2011. Habitat occupancy by riparian muskrats reveals tolerance to urbanization and invasive vegetation. Journal of Wildlife Management 75:1637–1645.
- Falaschi, M., C. Gibertini, E. Lo Parrino, M. Muraro, B. Barzaghi, R. Manenti, and G. F. Ficetola. 2022. Assessing population trends of species with imperfect detection: double count analyses and simulations confirm reliable estimates in brown frogs. Animals 12:2085.
- Gese, E. M. 2001. Monitoring of terrestrial carnivore populations. Pages 372–396 in , J. L. Gittleman, S. M. Funk, D. W. MacDonald, and R. K. Wayne, editors. Carnivore Conservation. Cambridge University Press, Cambridge, UK.
- Goldman, M. R., M. Shinderman, M. R. Jeffress, T. J. Rodhouse, and K. T. Shoemaker. 2023. Integrating multiple sign types to improve occupancy estimation for inconspicuous species. Ecology and Evolution 13:e10019.
- Green, R. H., and R. C. Young. 1993. Sampling to detect rare species. Ecological Applications 3:351–356.
- Grinnell, J. 1932. Habitat relations of the giant kangaroo rat. Journal of Mammalogy 13:305–320.
- Just, A. C., Y. Liu, M. Sorek-Hamer, J. Rush, M. Dorman, R. Chatfield, Y. Wang, A. Lyapustin, and I. Kloog. 2020. Gradient boosting machine learning to improve satellite-derived column water vapor measurement error. Atmospheric Measurement Techniques 13:4669–4681.
- Kahl, S., C. M. Wood, M. Eibl, and H. Klinck. 2021. BirdNET: A deep learning solution for avian diversity monitoring. Ecological Informatics 61:101236.
- Liu, Y., and A. Just. 2020. SHAPforxgboost: SHAP plots for ’XGBoost’. Version 0.2.0. Comprehensive R Archive Network, Vienna, Austria. https://cran.r-project.org/package=SHAPforxgboost
- Lonsinger, R. C., E. M. Gese, and L. P. Waits. 2015. Evaluating the reliability of field identification and morphometric classifications for carnivore scats confirmed with genetic analysis. Wildlife Society Bulletin 39:593–602.
- Lundberg, S., and S.-I. Lee. 2017. A unified approach to interpreting model predictions. Pages 4768–4777 in U. von Luxburg, I. Guyon, S. Bengio, H. Wallach, and R. Fergus, editors. NIPS’17: Proceedings of the 31st International Conference on Neural Information Processing Systems. Curran Associates Inc., Red Hook, NY, USA. https://doi.org/10.48550/ARXIV.1705.07874
- MacKenzie, D. I., J. D. Nichols, J. A. Royle, K. H. Pollock, L. Bailey, and J. E. Hines. 2017. Occupancy Estimation and Modeling: Inferring Patterns and Dynamics of Species Occurrence. Elsevier Science and Technology, Burlington, MA, USA.
- Mienye, I. D., and Y. Sun. 2022. A survey of ensemble learning: concepts, algorithms, applications, and prospects. IEEE Access 10:99129–99149.
- Miller, T., P. Kozlovska, A. Krzemińska, K. Lewita, J. Biedrzycka, and K. Geroch. 2023. XGBOOST in environmental ecology: a powerful tool for sustainable insights. Grail of Science 34:163–180.
- Ngoprasert, D., R. Steinmetz, D. H. Reed, T. Savini, and G. A. Gale. 2011. Influence of fruit on habitat selection of Asian bears in a tropical forest. Journal of Wildlife Management 75:588–595.
- Noon, B. R., L. L. Bailey, T. D. Sisk, and K. S. Mckelvey. 2012. Efficient species-level monitoring at the landscape scale. Conservation Biology 26:432–441.
- Olea, P. P., and P. Mateo-Tomás. 2011. Spatially explicit estimation of occupancy, detection probability and survey effort needed to inform conservation planning. Diversity and Distributions 17:714–724.
- Pichler, M., and F. Hartig. 2023. Machine learning and deep learning: a review for ecologists. Methods in Ecology and Evolution 14:994–1016.
- Prugh, L. R., and J. S. Brashares. 2012. Partitioning the effects of an ecosystem engineer: kangaroo rats control community structure via multiple pathways. Journal of Animal Ecology 81:667–678.
- Ray, J. C., and W. J. Zielinski. 2012. Track stations. Page 400 in R.A. Long, P. MacKay, W. J. Zielinski, and J.C. Ray, editors. Noninvasive Survey Methods for Carnivores. Island Press, Washington, D.C., USA.
- Semerdjian, A. E. 2019. Evaluation of range-wide occupancy and survey methods for the giant kangaroo rat (Dipodomys ingens). Thesis, Humboldt State University, Arcata, CA, USA.
- Semerdjian, A. E., H. S. Butterfield, R. Stafford, M. F. Westphal, and W. T. Bean. 2021. Combining occurrence and habitat suitability data improve conservation guidance for the giant kangaroo rat. Journal of Wildlife Management 85:855–867.
- Shannon, G., J. S. Lewis, and B. D. Gerber. 2014. Recommended survey designs for occupancy modelling using motion-activated cameras: insights from empirical wildlife data. PeerJ 2:e532.
- Shaw, W. T. 1934. The ability of the giant kangaroo rat as a harvester and storer of seeds. Journal of Mammalogy 15:275.
- Shonfield, J., and E. M. Bayne. 2017. Autonomous recording units in avian ecological research: current use and future applications. Avian Conservation and Ecology 12:art14.
- Sunarto, S., M. J. Kelly, K. Parakkasi, S. Klenzendorf, E. Septayuda, and H. Kurniawan. 2012. Tigers need cover: multi-scale occupancy study of the big cat in Sumatran forest and plantation landscapes. PLOS ONE 7:e30859.
- Wharton, C. A. 2006. Are we gathering reliable data? The need for measuring observer skill in wildlife monitoring. Thesis, Texas A&M University, College Station, TX, USA.
- Williams, D. F., M. K. Davis, and L. P. Hamilton. 1995. Distribution, population size, and habitat features of giant kangaroo rats in the northern segment of their geographic range. Bird and Mammal Conservation Program Report 95-01. California Department of Fish and Game, Sacramento, CA, USA.
- Williams, D. F., and K. S. Kilburn. 1991. Dipodomys ingens. Mammalian Species 1–7.