

MONOGRAPH
Robert Stanley*
California High-Speed Rail Authority, 770 L Street, Suite 620, Sacramento, CA 95814, USA https://orcid.org/ 0009-0001-2663-9211
*Corresponding Author: robert.stanley@hsr.ca.gov; rbs187@yahoo.com
Published 8 October 2026 • doi.org/10.51492/cfwj.112.9
Abstract
Transportation facilities such as bridges provide critical roosting habitat for bat species throughout California. This assessment analyzed 607 transportation facilities in Contra Costa County from the Federal Highway Administration’s National Bridge Inventory dataset. The primary objective was to analyze the structural design elements of transportation facilities with confirmed bat use in Contra Costa County. The assessment prioritized facilities for field surveys using existing spatial datasets of predicted suitable habitat for bat species known to utilize bridges in Contra Costa County. The assessment identified 334 facilities within suitable habitat and prioritized them for field survey. The assessment also randomly selected additional facilities outside the suitable habitat classification, resulting in 151 facilities surveyed. Field surveys confirmed bat use at 12 facilities and identified signs of potential bat use at 22 facilities that warrant further inspection. The confirmed use facilities ranged in age from 8 to 111 years old at the time of the analysis, including two built in 2018, one in 1991, one in 1981, four built between 1950 and 1975, and four constructed in 1949 or earlier. All confirmed use facilities exhibited similar structural design elements, featuring open girder construction with concrete superstructures and substructures, typically using concrete decks supported by concrete beams, with three facilities incorporating stay-in-place steel deck forms integrated into the concrete. All confirmed use facilities exhibited multiple 90° intersections of concrete girders, crossbeams, and abutments that created accessible voids for roosting. The secondary objective was to identify potential environmental variables to improve the predictive accuracy of suitable habitat spatial datasets for bat species associated with transportation facility use. The assessment analyzed environmental and landscape variables, including proximity to water, transportation noise, land use, land cover, and elevation. The assessment determined that further site-specific analysis is necessary to evaluate roost function, species present, and the potential relationship between transportation noise and bat occupancy. The assessment also analyzed roost networks of confirmed use facilities within Contra Costa County and determined a clustered spatial distribution. Overall, the assessment demonstrated that structural attributes and surrounding landscape context contribute to bat use and identified structural attributes, proximity to water features, land cover, and spatial relationships among facilities as potential inputs for improving suitable habitat spatial datasets.
Key words: bats, bridges, culverts, inventory, transportation, unmanned aerial vehicle, wildlife
| Citation: Stanley, R. 2026. Transportation facility assessment for bat use in Contra Costa County. California Fish and Wildlife Journal 112:e9. |
| Editor: Katrina Smith, Wildlife Branch |
| Submitted: 15 March 2026; Accepted: 13 May 2026 |
| Copyright: ©2026, Stanley. This is an open access article and is considered public domain. Users have the right to read, download, copy, distribute, print, search, or link to the full texts of articles in this journal, crawl them for indexing, pass them as data to software, or use them for any other lawful purpose, provided the authors and the California Department of Fish and Wildlife are acknowledged. |
| Competing Interests: The author has not declared any competing interests. |
Introduction
Approximately one in six bridges supports bat use in California (Erickson et al. 2003), highlighting the importance of transportation facilities including bridges, culverts, and undercrossings (hereafter facilities) to provide important habitat for species known to utilize them. Bats utilize these facilities as night roosts to rest between foraging bouts, maternity roosts used by reproductive females to give birth and raise young, day roosts occupied by reproductive and non-reproductive bats during daylight hours, and alternative roosts used intermittently by individuals or small numbers of bats (Johnston et al. 2019).
The San Francisco Bay Area (Bay Area), including Contra Costa County, supports 15 of the 25 bat species documented statewide in California, although not all 15 species use facilities for roosting (EBRPD 2018; Johnston et al. 2019). The assemblage of bat species across the greater Bay Area and Contra Costa County exhibits a gradient of facility use, ranging from common facility use to rare facility use (Johnston et al. 2019). Species identified as frequent or common facility users in Contra Costa County include Myotis yumanensis (Yuma myotis), Eptesicus fuscus (big brown bat), Antrozous pallidus (pallid bat), and Tadarida brasiliensis (Brazilian free-tailed bat). Occasional use species include Myotis lucifugus (little brown bat), Myotis evotis (long-eared myotis), Myotis thysanodes (fringed myotis), Myotis volans (long-legged myotis), Myotis californicus (California myotis), Myotis ciliolabrum (small-footed myotis), and Corynorhinus townsendii (Townsend’s big-eared bat), which primarily occupy natural roosts and may use facilities opportunistically. Rare facility use has also been documented by researchers for Lasionycteris noctivagans (silver-haired bat), although records are limited (Johnston et al. 2019).
All bat species, including the species known to utilize facilities, face multiple environmental stressors such as habitat loss. Habitat loss most often results from disturbance or removal of natural habitat types, particularly riparian habitat and trees. However, the removal or modification of facilities can also result in potentially significant impacts to bats by removing accessible roosting habitat during the repair, retrofit, or replacement of facilities as they approach the end of their expected 50-year service life (ASCE 2017). The permanent loss of access to this type of habitat is significant due to statewide estimates indicating 72% of bridges are approaching or have exceeded their 50-year service life (ASCE 2017). In Contra Costa County, the Federal Highway Administration’s National Bridge Inventory (NBI) identified 63.6% (n = 386) of the 607 facilities as having approached or exceeded their 50-year service life (FHWA 2022).
Modern transportation facility designs increasingly utilize standardized codes, guidelines, and prefabricated structural components. These standardized design practices may exclude structural features and design specifications conducive to bat roosting and can limit roost availability within transportation facilities. For instance, accelerated bridge construction (ABC) methods rely on lightweight precast deck slabs and girders that construction crews assemble onsite. ABC methods provide cost and project schedule advantages and allow clear-span bridge crossings of up to 30 m or more (ASCE 2017; Culmo et al. 2011) in locations where engineers previously could not span creeks or floodplains. ABC methods have many advantages; however, standardized facility designs may limit the crevices and recessed voids critical for bat roosting (Johnston et al. 2019; Erickson et al. 2003).
Building on these considerations, this assessment evaluated the relationship between confirmed bat use and transportation facility structural element design, environmental variables, and landscape variables. The primary objective was to evaluate the structural design elements associated with confirmed bat use across the transportation facility inventory in Contra Costa County. The secondary objective was to identify environmental variables associated with confirmed bat use that can improve the predictive accuracy of spatial datasets for bat use of transportation facilities. The assessment also analyzed the spatial distribution of confirmed use facilities to document associated roost networks within the riparian corridors of Contra Costa County.
This document is not intended to establish the presence or absence of bats at any facility or to serve as the environmental analysis for individual projects conducted by a facility owner. Bats are highly mobile, and patterns of use at facilities may vary seasonally, monthly, or even nightly. In California, all native bat species receive protection under state and, in some cases, federal law. The California Department of Fish and Wildlife (CDFW) classifies bats as non-game mammals; under California Fish and Game Code section 4150, non-game mammals may not be taken, possessed, or killed without appropriate authorization. Only trained professionals that possess the proper qualifications, authorizations, and use the proper personal protective equipment should handle bats.
Methods
Initial Facility Analysis
The initial facility analysis used open-source data from the Federal Highway Administration’s National Bridge Inventory (FHWA 2022) to develop a Geographic Information System (GIS) inventory map (Fig. 1) of all 607 facilities (Appendix I) within Contra Costa County. The initial facility analysis reduced the NBI dataset size by selecting a subset of facilities from the attribute table within California (Code 6: California) and Contra Costa County (Code 13: Contra Costa County) using the ‘create new layer selection’ function in GIS software. The analysis retained all NBI element data in the attribute table including year built, structure material, and facility owner.

Suitable Habitat Analysis
The suitable habitat analysis used predictive suitable habitat datasets available through the CDFW’s Biogeographic Information Observation System (BIOS; CDFW 2025a) for bat species identified in Johnston et al. (2019) and EBRPD (2018) known to utilize facilities within Contra Costa County. The suitable habitat analysis used the following suitable habitat datasets from BIOS: pallid bat (DS-2497), big brown bat (DS-2491), Townsend’s big-eared bat (DS-2496), Brazilian free-tailed bat (DS-2498), California myotis (DS-2487), and Yuma myotis (DS-2482). The suitable habitat analysis selected only these datasets rather than the entire assemblage of species known to utilize facilities described in the Introduction. The analysis selected these datasets based on their spatial coverage in Contra Costa County, lack of redundancy with other datasets, and ability to collectively represent the full range of documented bat use behaviors, including frequent, occasional, and rare or opportunistic use (Johnston et al. 2019).
The predictive suitable habitat datasets, developed independently of this assessment, categorize habitat suitability using raster data classified as low (<0.34), medium (0.34–0.66), and high (>0.66) based on average scores for reproduction, habitat cover, and feeding potential. For this assessment, the suitable habitat analysis retained high suitability raster classes and excluded low suitability classes, given the near-universal coverage of land area across California. The analysis also excluded medium suitability raster classes to prioritize areas more likely to support bat use, with exceptions described below.
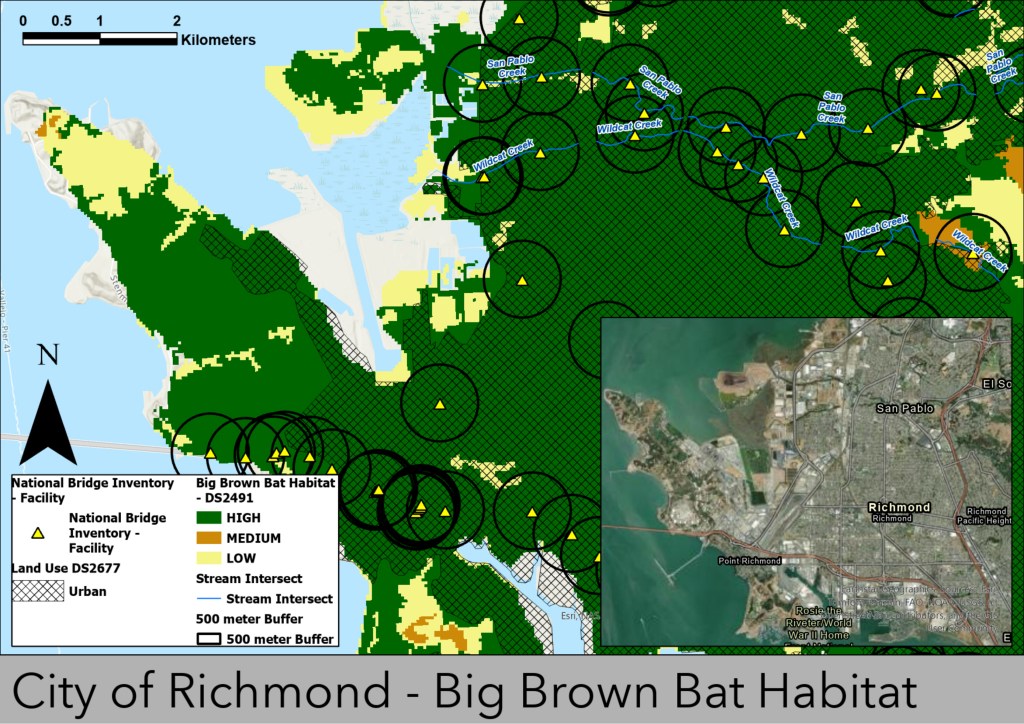
The first exception applied to DS-2496 (Townsend’s big-eared bat), which included only low and medium suitability raster classes; therefore, the analysis retained only the medium suitability raster classes. The second exception applied to DS-2491 (big brown bat). For DS-2491, medium suitability raster classes appeared to align with natural areas and open space, while high suitability raster classes corresponded with extensively developed land use areas as depicted by the CDFW land use dataset (DS-2677; CDFW 2025a) without extensive riparian corridors or open space. Figure 2 illustrates this potential mismatch by showing high suitability raster class habitat overlapping with highly industrialized zones near the City of Richmond, Contra Costa County, USA. To account for this potential mismatch, the analysis removed both low and high raster suitability classes for DS-2491 and included only medium suitability.
Additionally, Johnston et al. (2019) classified Myotis lucifugus (little brown bat) as an associated use bat species; however, no Contra Costa County data were available in the predictive suitable habitat dataset (DS-2480), so the suitable habitat analysis excluded the dataset. The analysis also excluded datasets for long-eared myotis (DS-2484), fringed myotis (DS-2485), long-legged myotis (DS-2486), and western small-footed myotis (DS-2488) due to high redundancy and spatial overlap with California myotis (DS-2487) and Yuma myotis (DS-2482). The analysis also excluded silver-haired bat (DS-2489) due to inconsistent dataset outputs, including anomalous circular polygon features that lacked ecological interpretation.
Raster to Polygon Conversion
The suitable habitat analysis converted the predicted habitat suitability datasets from raster format to individual polygon feature classes for pallid bat (DS-2497), big brown bat (DS-2491), Townsend’s big-eared bat (DS-2496), Brazilian free-tailed bat (DS-2498), California myotis (DS-2487), and Yuma myotis (DS-2482) using the raster to polygon tool in GIS software. The analysis merged the individual species polygon feature classes into a single polygon feature class that combined all bat species data into a single habitat suitability layer (hereafter suitable habitat layer).
Suitable Habitat Facility Determination
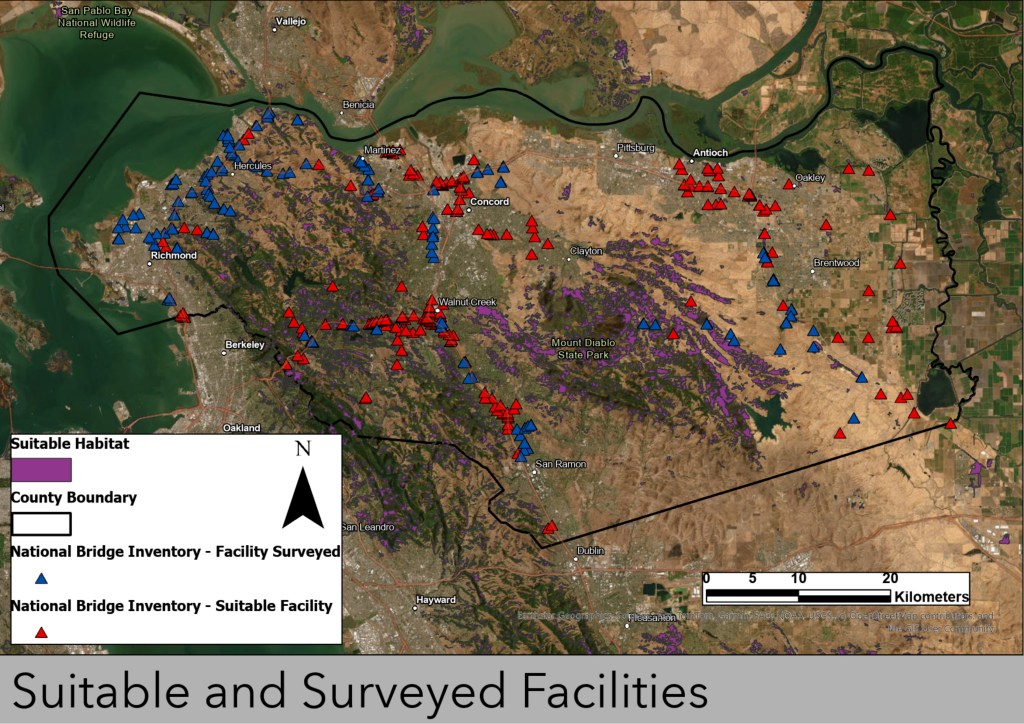
The suitable habitat facility determination process inserted the suitable habitat layer previously described into the 607-facility inventory map derived from the NBI dataset using GIS software. The suitable habitat facility determination process applied a 100-m buffer to each facility point using the buffer tool in GIS software (Fig. 3). The determination process then classified any facility where the suitable habitat layer intersected the buffer as suitable for potential bat use (hereafter suitable habitat facility), resulting in the initial identification of 283 suitable habitat facilities.

The determination process also accounted for nearby facilities that may not occur within the buffer of the suitable habitat layer but have the potential to function as secondary or alternative roosts. The assessment applied a 500-m buffer to each of the initial 283 suitable habitat facility points and classified any facility within the buffer as a suitable habitat facility (Fig. 3). This approach is based on the ecological premise that some bat species use riparian corridors as travel routes and may move among multiple facilities during nightly foraging (Hilty and Merenlender 2004; see Discussion).
The process for suitable habitat facility determination also incorporated occurrence records from the California Natural Diversity Database (CNDDB; DS-45; CDFW 2025b). The process applied a 500-m buffer to each of the initial 283 suitable habitat facility data points and classified facilities with documented species occurrences within the buffer as suitable habitat facilities. Based on the previously described criteria, the process determined a total of 334 suitable habitat facilities (Fig. 4) prioritized for field surveys.
The suitable habitat facility determination process employed the 100-m buffer to capture immediate habitat context that may influence roost suitability and near roost foraging conditions, consistent with spatial scales used in previous studies, while the 500-m buffer reflects broader local landscape conditions and aligns with documented local to intermediate bat response scales of less than 720 m reported by Starbuck et al. (2020; see Discussion). The determination process also selected these buffer distances as ecological benchmarks while considering their analytical utility; applying a broader buffer to all initial facilities would have selected nearly the entire facility inventory for field surveys.
Field Maps Application Survey
The assessment converted the 607-facility inventory map derived from the NBI dataset into a Field Maps application using GIS software for smartphone-based field surveys (ArcGIS Field Maps, v.22.2, Environmental Systems Research Institute, Redlands, CA, USA). The assessment also configured the inventory map to retain all attribute fields associated with each facility from the NBI dataset and included georeferenced image capture for each facility data point using GIS protocols.
Field Surveys
The assessment conducted field surveys from 2022 to 2024 and focused on the 334 suitable habitat facilities (Appendix I). The assessment also randomly selected additional facilities that were not identified as suitable habitat facilities for field surveys. The assessment did not survey facilities with unresolved safety concerns or access limitations. All field surveys occurred during daylight hours and consisted of visual inspection for bat use.
All field surveys followed guidance in the Bats and Bridges Technical Bulletin (Erickson et al. 2003). Survey duration varied based on facility design complexity and site conditions. The Field Maps application georeferenced and attached images collected during field surveys for each facility. Field surveys documented structural elements, structure identification numbers (hereafter structure ID), and mile markers in accordance with the facility assessment and inspection protocols outlined in the Indiana Department of Transportation Appendix D: Bridge/Structure Bat Assessment Form (USFWS/IDOT 2010).
Field surveys also used unmanned aircraft systems (UAS) when direct visual surveys were not feasible due to facility height, presence of water, or structural complexity. UAS field surveys documented surrounding landscape conditions at facilities with confirmed bat use (hereafter confirmed use facilities; Figs. 5–9) in all cardinal directions using image capture, when flight operations complied with Federal Aviation Administration regulations. For all confirmed use facilities, the assessment conducted additional field surveys at the nearest neighboring facility within a 500-m radius, proceeding to the next nearest facility until no additional neighboring facilities remained, to evaluate their potential as an additional roost within a localized roost network.

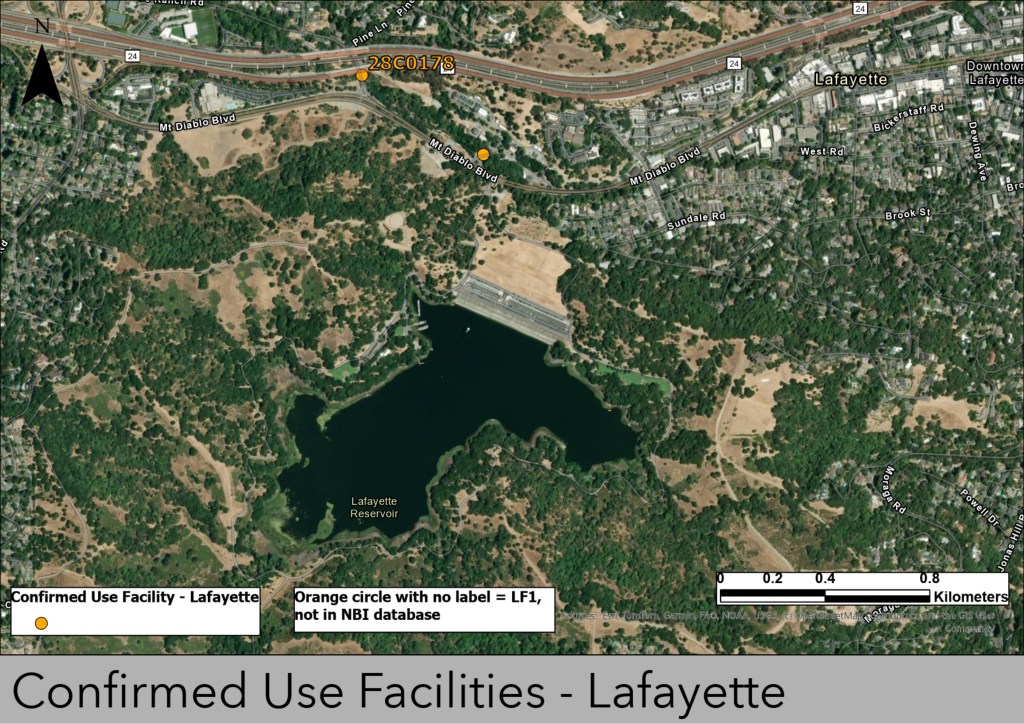

Field surveys occurred at 151 facilities (hereafter facilities surveyed) across Contra Costa County (Appendix I). When surveys could not confirm bat use and identified evidence of potential use, including the presence of Cliff Swallow (Petrochelidon pyrrhonota) nests, the assessment classified the facility as a potential use facility (hereafter potential use facility). The assessment identified 22 potential use facilities (Appendix I). The Discussion describes the association between Cliff Swallow nests and bat roosting and provides the rationale for the nearest neighbor survey approach.
Guano Use Level Analysis
The assessment qualitatively analyzed all confirmed use facilities during field surveys based on the degree of guano staining and accumulation, which served as an indicator of relative bat use intensity following methods described in Kunz and Parsons (2009). The assessment defined low (1) as isolated, scattered stains with faint coloration; medium (2) as noticeable accumulation with multiple patches and darkened surfaces; and high (3) as extensive staining characterized by thick guano deposits, strong odor, and the presence of insects or flies.
Transportation Noise Level Analysis
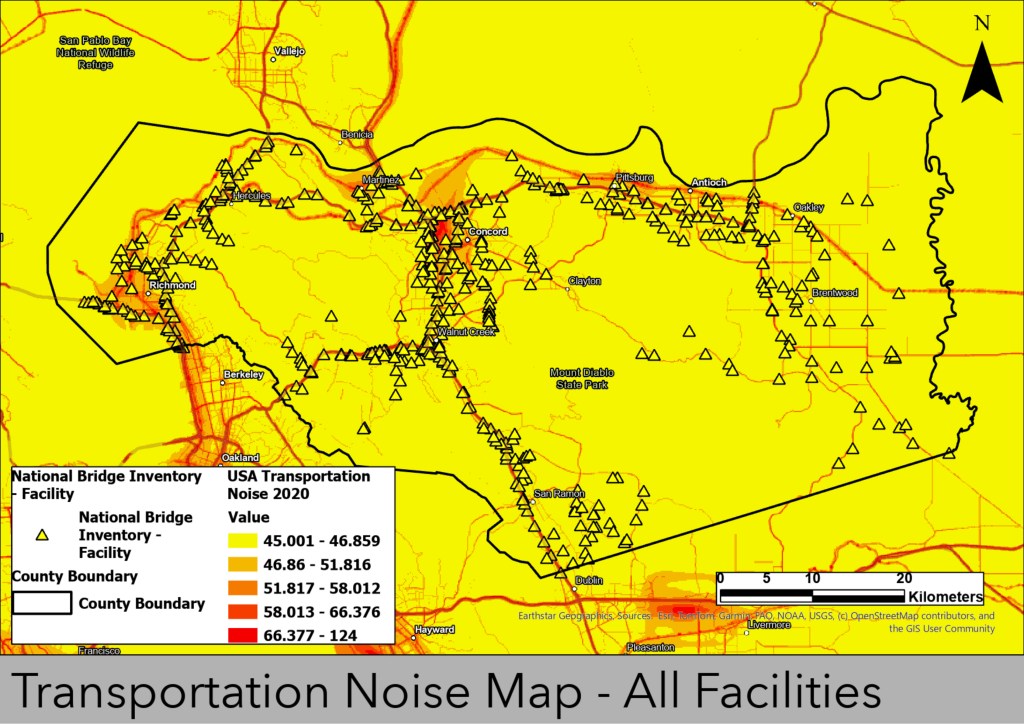
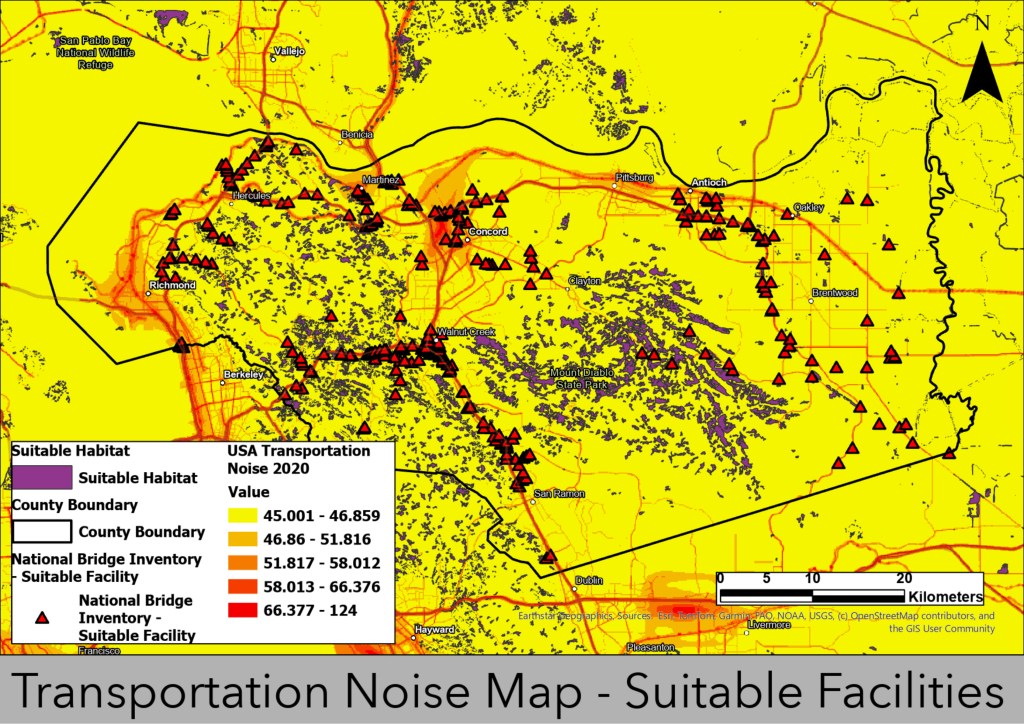
The assessment obtained modeled transportation noise data from the U.S. Department of Transportation National Transportation Noise Map (USDOT 2020), which provides continuous estimates of 24-hour equivalent A-weighted sound levels (LAeq, 24h) in decibels (dB). For analysis and display, the assessment summarized continuous raster surface data into decibel range intervals. The assessment overlaid the USDOT 2020 noise maps onto the facility inventory map with all 607 facilities, 334 suitable habitat facilities, 151 facilities surveyed, 22 potential use facilities, and 12 confirmed use facilities to evaluate transportation noise levels. The assessment used the intersect tool in GIS software to characterize the noise output range for each facility type (Figs. 10–12). The assessment used the noise output range layer as a spatial proxy for relative noise conditions at facilities and did not use it to represent bat auditory perception or sensitivity, which differs substantially from human-weighted acoustic metrics.

Facility Structural Attribute Analysis
The assessment analyzed structural attributes to identify consistent structural elements of the facilities within the study area. The NBI dataset used structure ID as a naming convention for facility data points. Multiple data points possessed the same structure ID, representing directional spans, parallel structures, ramps, or closely spaced crossings. The assessment assigned each mapped facility data point a unique global ID in GIS software to provide an individual identifier for all facilities. The assessment spatially analyzed each facility data point and attribute field to determine whether facilities sharing a structure ID represented separate spatial features with distinct footprints and treated facilities with distinct footprints as separate analytical units (Appendix I). For facilities with confirmed bat use, the assessment aggregated facilities when field surveys indicated that they were structurally connected, avoiding overcounting confirmed use facilities.
The assessment analyzed the structural attribute fields from the NBI dataset using GIS software to determine consistent patterns in structural design elements across all facility types (all facilities, suitable habitat facilities, facilities surveyed, potential use facilities, and confirmed use facilities). The assessment also evaluated field survey results and facility images to identify similar structural elements. The assessment based all structural element nomenclature on common terminology found in the NBI, Erickson et al. (2003), and Johnston et al. (2019).
Land Cover Use Analysis
The assessment analyzed land cover use by applying a 500-m buffer around all 607 facilities, 334 suitable habitat facilities, 151 facilities surveyed, 22 potential use facilities, and 12 confirmed use facilities in GIS software using the 2021 National Land Cover Database (NLCD), California subset (Dewitz 2023) layer. The intersect tool identified NLCD land cover classes occurring within each buffer, and the assessment added the resulting “Value” attribute field to the facility type in the NBI dataset. The assessment calculated the percent land cover composition within the attribute field for each facility by selecting the NLCD “Value” field, computing the proportion of each land cover category relative to the total area within the 500-m buffer radius, and aggregating results across similar facility types.
Nearest Neighbor Analysis
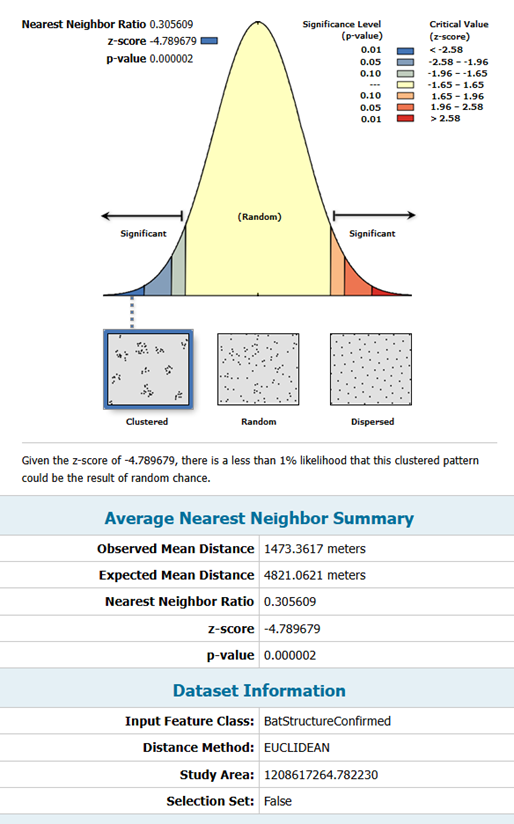
Nearest neighbor analysis used the average nearest neighbor tool in GIS software to evaluate whether the spatial distribution of confirmed use facilities differed from a random pattern, based on Euclidean distance between confirmed use facilities.
Habitat and Soil Type Analysis
The assessment analyzed the U.S. Geological Survey soil dataset (USGS 2023) at all facility types previously noted in Land Cover Use Analysis and determined the percent of soil type composition using the same methods described therein.
Water Feature Proximity Analysis
The water feature proximity analysis used GIS software to determine the proximity of confirmed use facilities to the nearest water feature. The analysis calculated three distances for each facility: (1) distance to the nearest water feature of any type, (2) distance to the nearest perennial water feature, and (3) distance to the nearest reservoir. For the first measure, the analysis included any water feature type, including streams, rivers, channels, canals, lakes, ponds, reservoirs, wetlands, coastal water bodies, estuarine water bodies, and similar features. For the second measure, the analysis considered only perennial water features. For the third measure, the analysis considered only reservoirs. The analysis measured proximity from each facility data point to the centroid of the nearest water feature in the California Aquatic Resource Inventory (CARI), Version 2 (SFEI 2017) using the near tool in GIS software.
Elevation Analysis
The elevation analysis extracted elevation data from a 10-m digital elevation model dataset (USGS 3DEP 2024) at each facility using the extract values to points tool in GIS software for all facility types. The assessment extracted values for the absolute elevation at each facility location. The assessment grouped elevation data by facility type, and generated summary statistics, including the mean, minimum, maximum, and standard deviation for each group.
Study Area
All 607 facilities are located within Contra Costa County in the Bay Area. Contra Costa County is bounded by San Pablo Bay to the west, the Carquinez Strait to the north, and the Sacramento–San Joaquin River Delta to the northeast, with Alameda County to the south and San Joaquin County to the east. Contra Costa County covers 2,080 km² and supports diverse habitats, including wetlands, grasslands, oak woodlands, chaparral, streams, and riparian areas that provide habitat for a variety of fish and wildlife.
Results
Facility Survey Results
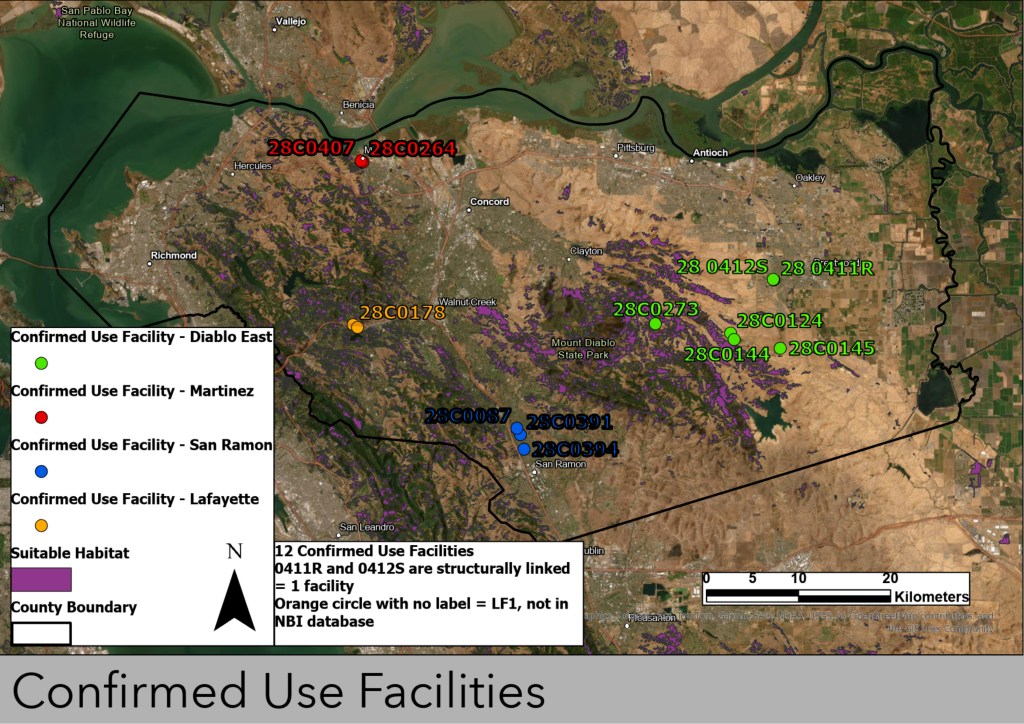
The assessment determined 221 facilities were <40 years old, 51 facilities were 40–49 years old, 293 facilities were 50–74 years old, and 42 facilities were ≥75 years old. The assessment classified 334 facilities as suitable habitat facilities for field surveys and surveyed 151 facilities, including randomly selected facilities outside the suitable habitat classification. Field surveys classified 22 facilities as potential use facilities and 12 facilities as confirmed use facilities (Appendix I). The assessment initially classified 13 confirmed use facilities (Fig. 5). The assessment reduced the number to 12 after determining that structure IDs 28 0411R and 28 0412S, both in the Diablo East cluster, shared a structural connection and functioned as a single facility to avoid an overestimate of confirmed use facilities. The suitable habitat facility determination process identified 12 confirmed use and 22 potential use facilities among the 334 suitable habitat facilities identified prior to field surveys (see Methods).
Confirmed Use and Structural Context
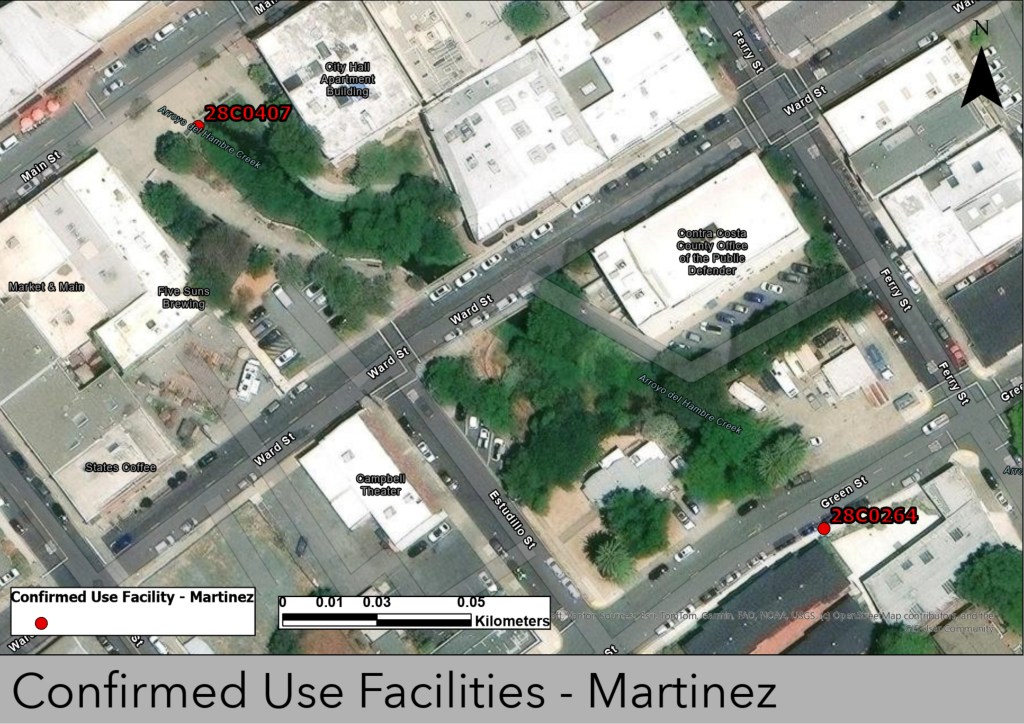
Confirmed use facilities formed spatial clusters in four distinct groups within Contra Costa County: Diablo East along the Marsh Creek Road corridor, east of Mount Diablo; Martinez along the Arroyo del Hambre corridor in downtown Martinez; Lafayette in the vicinity of the Lafayette Reservoir; and San Ramon along San Ramon Creek and the Camino Tassajara corridor (Figs. 5–9; Table 1).
Table 1. Confirmed use facilities and guano use levels. Structural IDs 28 0411R and 28 0412S are structurally connected and determined as one facility for this assessment. *Not in National Bridge Inventory (NBI) Database. Guano Use: 1 = Low; 2 = Medium; 3 = High. Facility Type: 2 = stringer/multi-beam or girder; 4 = T-beam; 19 = culvert.
| Structure ID | Geographic Cluster | Year Constructed | Facility Type | Guano Use Level |
| 28 0411R | Diablo East | 2018 | 2 | 1 |
| 28 C0124 | Diablo East | 1991 | 2 | 2 |
| 28 0412S | Diablo East | 2018 | 2 | 1 |
| 28 C0178 | Lafayette | 1969 | 2 | 3 |
| 28 C0087 | San Ramon | 1965 | 2 | 2 |
| 28 C0394 | San Ramon | 1975 | 4 | 2 |
| 28 C0391 | San Ramon | 1963 | 4 | 2 |
| 28 C0273 | Diablo East | 2018 | 2 | 2 |
| 28 C0407 | Martinez | 1925 | 4 | 1 |
| 28 C0144 | Diablo East | 1981 | 4 | 2 |
| 28 C0145 | Diablo East | 1937 | 2 | 1 |
| 28 C0264 | Martinez | 1940 | 19 | 1 |
| LF1* | Lafayette | 1915 | 2 | 1 |
The 12 confirmed use facilities ranged across age classes; four (33%) were 75 years or older (constructed in 1949 or earlier), four (33%) were 50–75 years old (constructed between 1950 and 1975), one (8%) was 44 years old (constructed in 1981), one (8%) was 34 years old (constructed in 1991), and two (17%) were 8 years old (constructed in 2018) at the time of this assessment.
Of the 12 confirmed use facilities, 11 (92%) were bridges and one (8%) was a culvert. Eleven of the 12 confirmed use facilities were included in the NBI dataset; NBI categorized 10 as bridges and one as a culvert, structure ID 28 C0264 (Martinez). LF1 (Lafayette) was not included in the NBI dataset and was categorized as a stringer/multi-beam or girder bridge during field surveys.
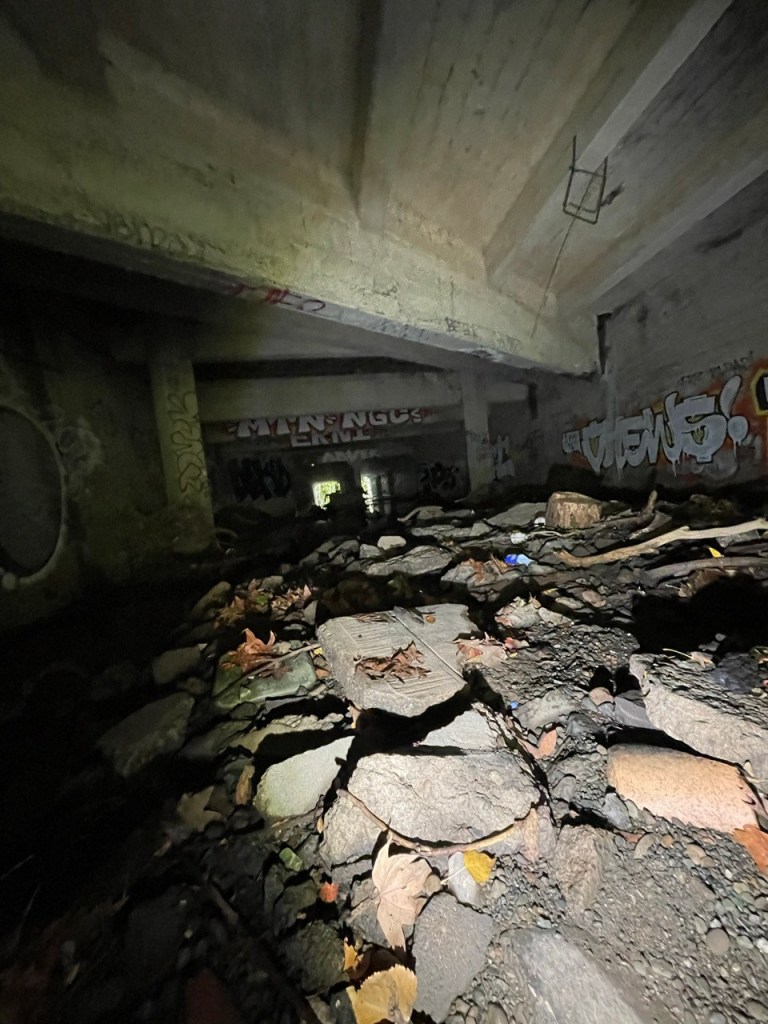
Field surveys further determined structure ID 28 C0264 (Martinez) contained a subterranean area that exceeded 465 m² and included multiple headwalls and interconnected conveyance barrels that opened into a large, cavernous space. The assessment concluded that, as configured, the facility functioned more as an extensive enclosed subsurface space than as a typical box culvert with structural elements similar to that of an enclosed bridge.
All confirmed use facilities consisted of reinforced concrete with exposed underdecks that formed angular crevices and accessible voids at intersections of the girders, pile caps, and abutments. These facilities primarily exhibited T-beam, I-beam, or box-girder configurations (Table 1). Of the confirmed use facilities, 9 of 12 incorporated concrete deck support, and the remaining three used stay-in-place steel deck forms above concrete supporting beams. All confirmed use facilities contained rows of concrete girders, pile caps, headers, and abutment walls, forming interconnected 90° angles between substructure and superstructure components (Figs. 13–24).


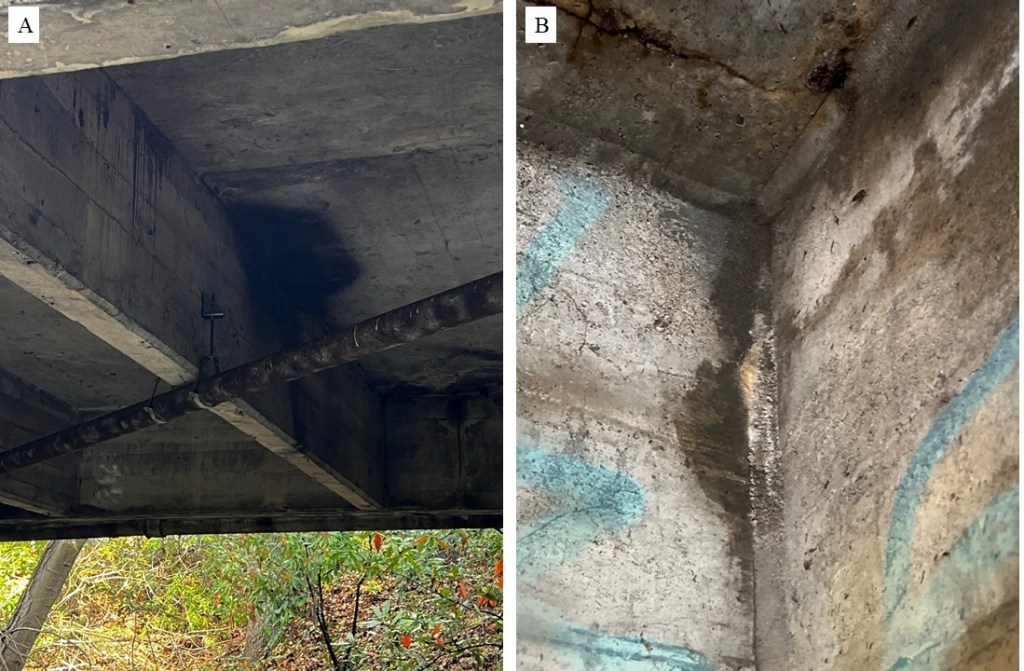
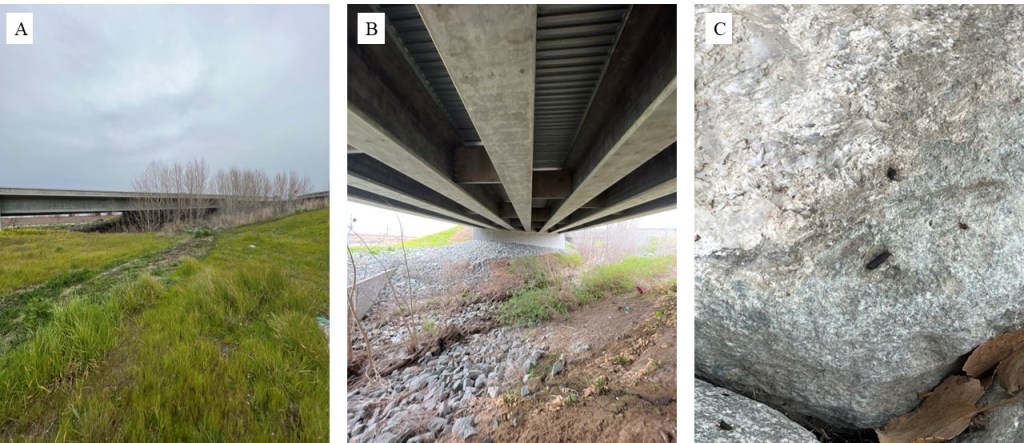
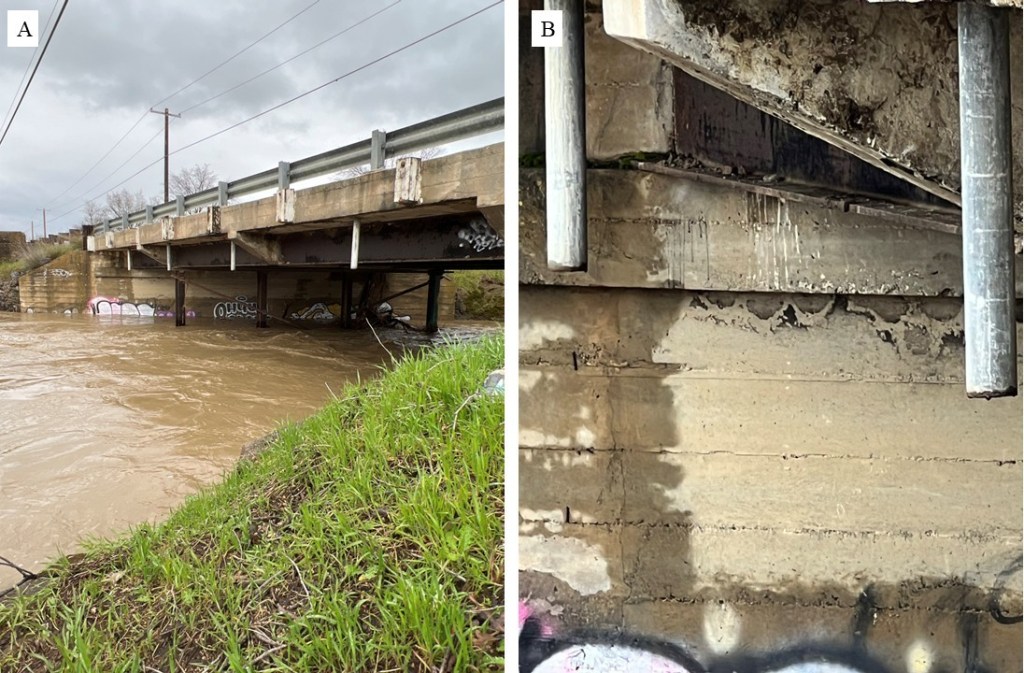
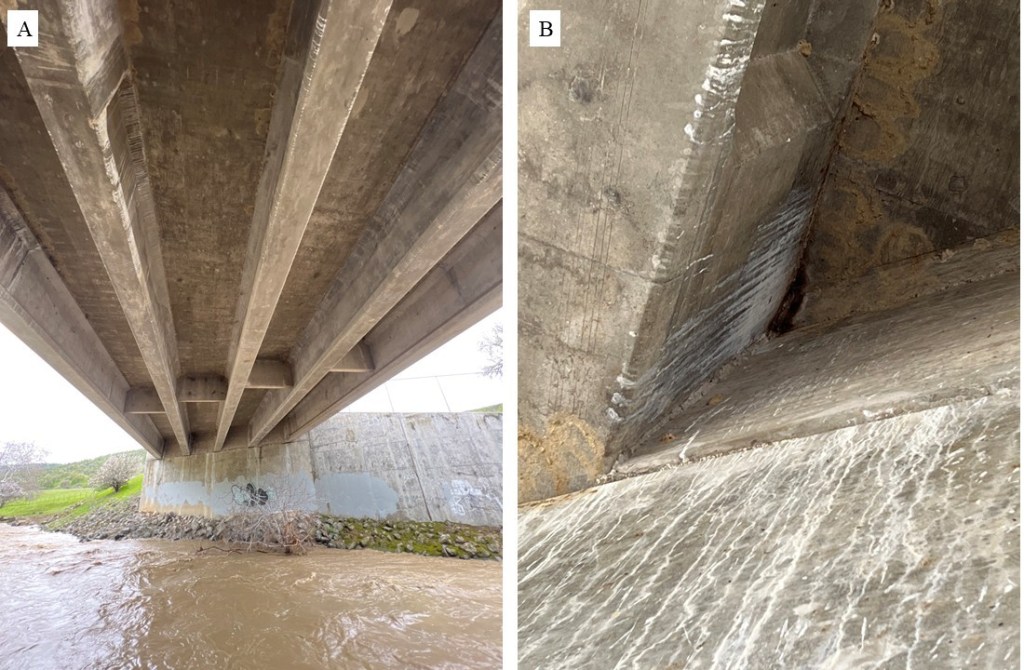
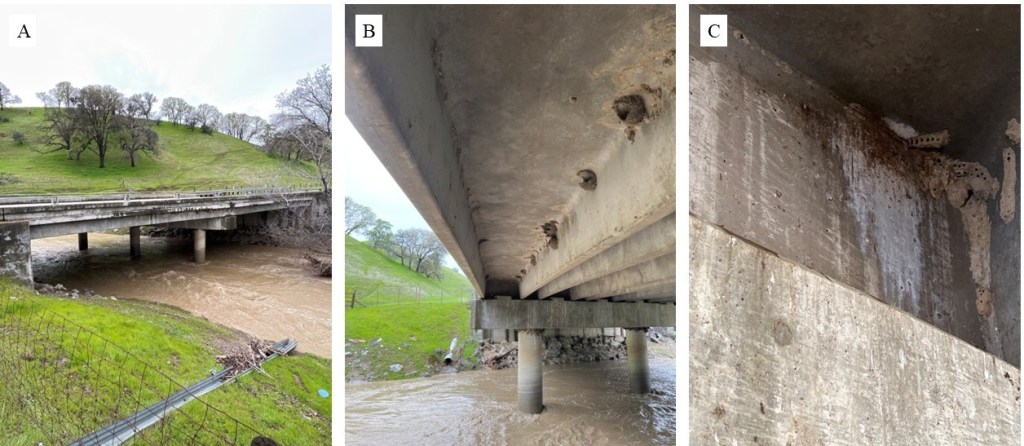

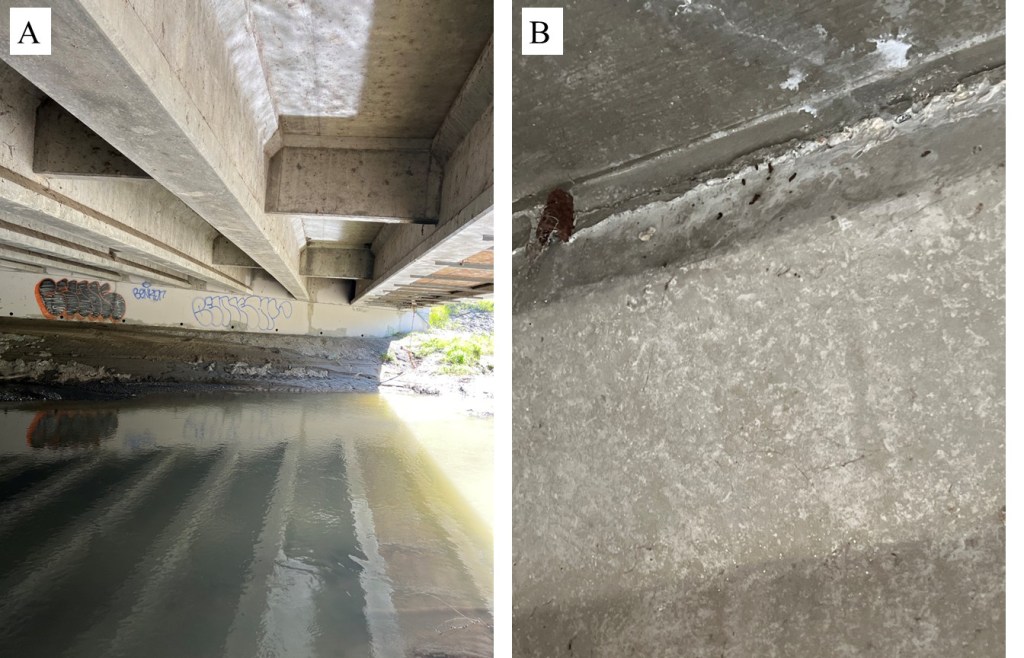

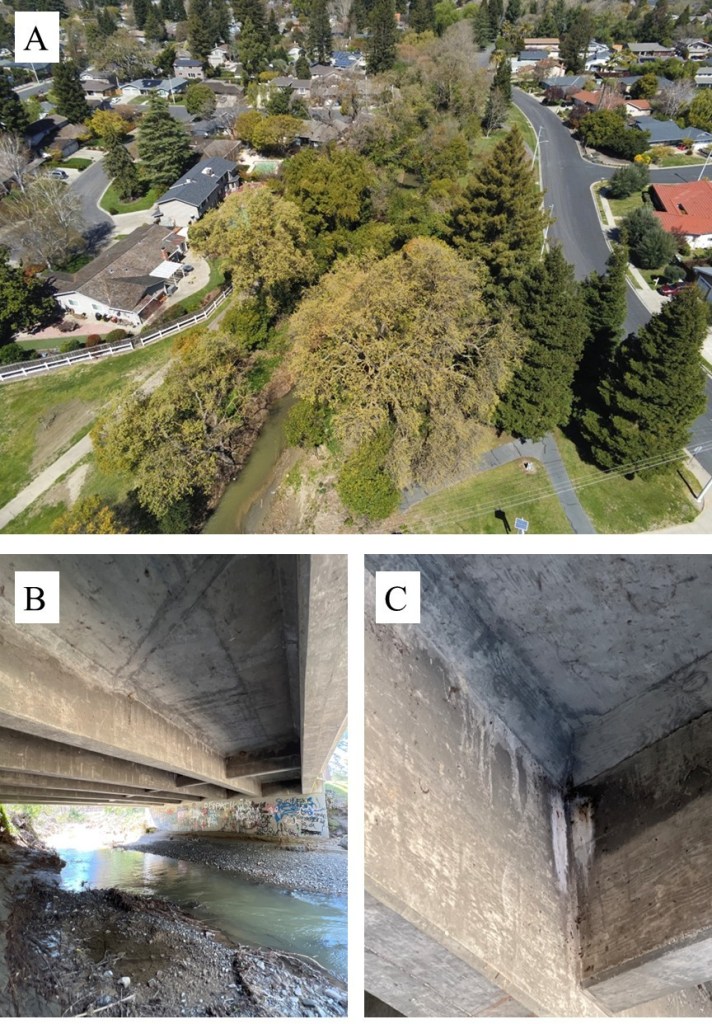
The NBI “bridge_con” attribute field and structural classifications indicated that girder type (G) designs dominated across all facilities in the study area. Girder type designs represented 66.7% of confirmed use facilities (n = 12), 68.2% of potential use facilities (n = 22), 48.8% of suitable habitat facilities (n = 334), and 51.9% of all facilities (n = 607). Flat-slab or framed (F) designs comprised 16.7% of confirmed use facilities, 22.7% of potential use facilities, 42.8% of suitable habitat facilities, and 41.8% of all facilities. Prestressed or post-tensioned (P) designs accounted for 16.7% of confirmed use facilities, 9.1% of potential use facilities, 7.8% of suitable habitat facilities, and 6.3% of all facilities.
Facility owners replaced structure ID 28 C0145 and 28 C0143 following completion of this assessment along Marsh Creek Road in the Diablo East cluster with modern prestressed girder (P-type) designs. The assessment classified the previous facilities as a confirmed use facility (T-beam) and a potential use facility (multi-beam girder), respectively. The assessment did not survey the replacement facilities (see Discussion).
Confirmed Use Facility Guano Use Level Results
Guano use levels spanned the full range of low (1), medium (2), and high (3) use levels. The assessment classified six confirmed use facilities as medium use. The assessment classified five facilities as low use, and one facility, structure ID 28 C0178 (Lafayette), as high use (Table 1). The observed use levels suggest a gradient of activity across the 12 confirmed use facilities that may reflect differences in the frequency or duration of use at individual facilities. Facilities exhibiting medium to high use levels may indicate more frequent or sustained use, whereas lightly stained facilities, exhibiting low use levels, may represent intermittent or secondary use.
Transportation Noise Results
The assessment used modeled transportation noise data from USDOT 2020 to evaluate 24-hour equivalent A-weighted sound levels (LAeq,24h) across the study area, representing modeled human-weighted transportation noise exposure. The highest decibel range (66–124 dB) occurred primarily within interstate and highway rights of way. Intermediate decibel ranges (59–65 dB) and lower decibel ranges (45–58 dB) occurred primarily outside transportation corridors (Figs. 10–12). Five of the 12 confirmed use facilities occurred within the highest decibel range. The remaining seven confirmed use facilities occurred within intermediate and lower decibel ranges outside primary transportation rights of way.
Three of the four confirmed use clusters (Diablo East, Lafayette, and San Ramon) exhibited transitions from the highest decibel range within transportation corridors to intermediate and lower decibel ranges outside the right of way. Only the Martinez cluster overlapped entirely within the highest decibel range. Suitable habitat facilities predominantly occurred within the lowest decibel range and showed limited overlap with the highest decibel range (Figs. 10–12). These modeled noise ranges represent relative noise conditions at facilities and do not characterize bat auditory perception or sensitivity, which differs substantially from human-weighted acoustic metrics (see Discussion).
Land Cover Use and Habitat Analysis Results
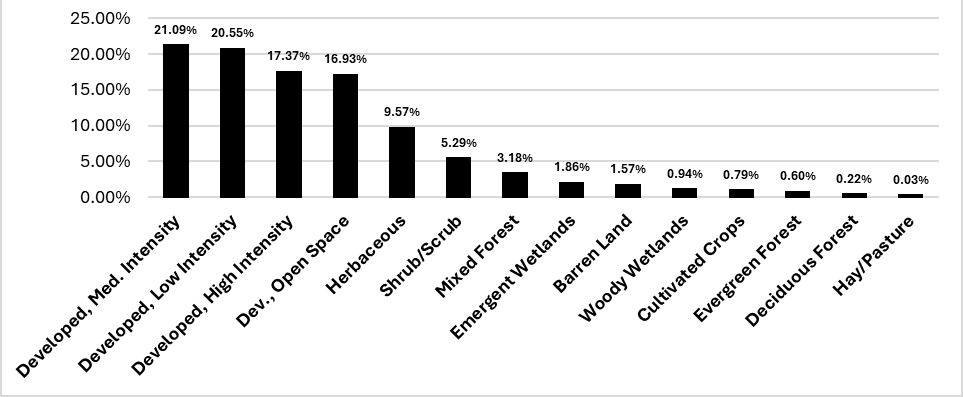
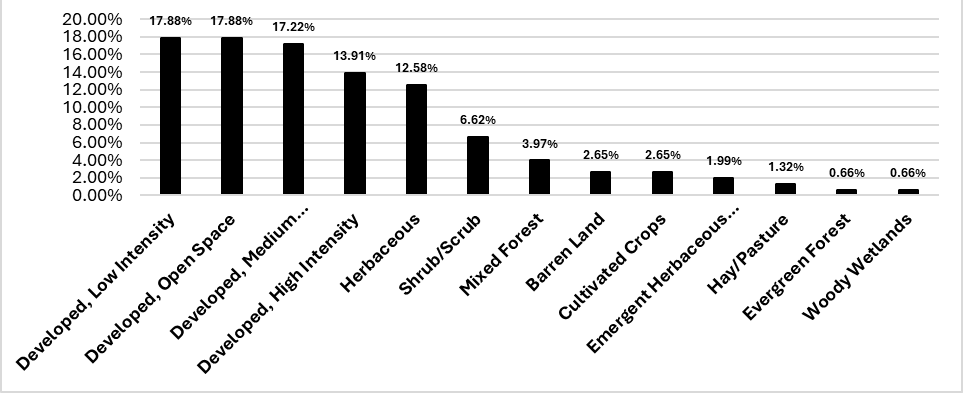
The assessment evaluated land cover use and habitat composition by facility type, including all facilities, suitable habitat facilities, facilities surveyed, potential use facilities, and confirmed use facilities, using land cover within a 500 m buffer surrounding each facility (Figs. 25–29).



For confirmed use facilities, developed, open space accounted for 19.69% of land cover within the 500 m buffer, followed by developed, low intensity and developed, medium intensity at 16.54% each, and developed, high intensity at 14.96%. Herbaceous habitat comprised 11.81%, and mixed forest comprised 6.30%. The remaining 14.16% of land cover was distributed among the remaining categories, each representing less than 4% of the buffer area.
For potential use facilities, developed, low intensity and developed, open space were the most prevalent categories at 17.88% each, followed by developed, medium intensity at 17.22% and developed, high intensity at 13.91%. Herbaceous habitat comprised 12.58%, and shrub/scrub 6.62%. The remaining 13.91% of land cover was distributed among the remaining categories, each representing less than 4% of the buffer area.
For suitable habitat facilities, developed, medium intensity accounted for 26.05% of land cover within the 500 m buffer, followed by developed, low intensity at 23.02% and developed, high intensity at 22.01%. Developed, open space comprised 16.28%, and herbaceous habitat 6.41%. The remaining 6.23% of land cover was distributed among the remaining categories, each representing less than 2% of the buffer area.
For facilities surveyed, developed, medium intensity accounted for 21.09% of land cover within the 500 m buffer, followed by developed, low intensity at 20.55%, developed, high intensity at 17.37%, and developed, open space at 16.93%. Herbaceous habitat comprised 9.57%, and mixed forest 3.18%. The remaining 11.31% of land cover was distributed among the remaining categories, each representing less than 2% of the buffer area.
Across all facilities, developed, medium intensity accounted for 27.57% of land cover within the 500 m buffer, followed by developed, high intensity at 23.65%, developed, low intensity at 22.23%, and developed, open space at 15.14%. Herbaceous habitat comprised 5.64%. The remaining 5.77% of land cover was distributed among the remaining categories, each representing less than 2% of the buffer area. The complete percentage distribution of land cover use categories for each facility type is presented in Figs. 25–29.
Nearest Neighbor Results
Nearest neighbor analysis indicated that confirmed use facilities exhibited a significantly clustered spatial pattern (nearest neighbor ratio = 0.306, Z = –4.79, P < 0.001), reflecting closer than expected spacing relative to a random distribution (Fig. 30).
Soil Type Analysis Results
The U.S. Soils dataset (USGS 2023) identified the baseline soil distribution in Contra Costa County as Vertisols 30.61%, Mollisols 26.25%, Alfisols 15.24%, Inceptisols 14.07%, Entisols 9.85%, and Histosols 3.99%. Across all facilities, soils consisted of Vertisols 38.25%, Mollisols 25.62%, Alfisols 25.06%, Inceptisols 6.30%, Entisols 4.65%, and Histosols 0.12%. Suitable habitat facilities occurred on soils comprising Vertisols 37.68%, Mollisols 31.53%, Alfisols 22.47%, Inceptisols 4.93%, Entisols 3.26%, and Histosols 0.13%. Potential use facilities occurred on soils comprising Mollisols 39.02%, Vertisols 32.52%, Alfisols 13.01%, Entisols 8.94%, and Inceptisols 6.51%. Facilities surveyed occurred on soils comprising Vertisols 35.63%, Mollisols 33.42%, Alfisols 14.73%, Inceptisols 13.23%, and Entisols 2.99%. Confirmed use facilities occurred on soils comprising Mollisols 36.73%, Vertisols 33.67%, Alfisols 21.43%, Inceptisols 6.13%, and Entisols 2.04%.
Water Feature Proximity Analysis Results
Water feature proximity analysis determined that the nearest water feature for 11 of the 12 confirmed use facilities occurred at 0 m. For all 11 instances, the confirmed use facility was situated directly over a creek water feature. The remaining confirmed use facility, structure ID 28 C0178 (Lafayette), was located 55 m from the nearest mapped water feature, Lafayette Creek (Table 2). Lafayette Creek passed directly beneath the transportation facility through a culvert; the upstream and downstream openings were 55 m from the facility. The culvert facility was not accessible due to safety concerns. Distances to the nearest perennial water body ranged from 800 m to 10.9 km for all confirmed use facilities and included the Lafayette Reservoir, Marsh Creek Reservoir, Shadow Lake, Eagle Lake, Contra Loma Reservoir, and the Carquinez Strait (Table 2). Distances to the nearest reservoir ranged from 800 m to 11.66 km, with the closest reservoir (Lafayette Reservoir) occurring 800 m from structure ID 28 C0178 (Lafayette) (Table 2). Reservoirs nearest to confirmed use facilities included the Contra Loma Reservoir, Lafayette Reservoir, Mallard Reservoir, Marsh Creek Reservoir, and San Leandro Reservoir (Table 2).
Table 2. Water feature and water body proximity. Nearest water feature refers to a creek in all cases. Nearest perennial water body represents the closest perennial aquatic feature. Nearest reservoir reflects the closest reservoir. Column 2 lists these features in the following order: nearest water feature, nearest perennial water body, and nearest reservoir. LF1 does not have a structure ID.
| Structure ID | Nearest Water Feature / Nearest Perennial Water Body / Nearest Reservoir | Water Feature Distance | Perennial Water Body Distance | Reservoir Distance |
| 28 0411R | Deer Creek / Shadow Lake / Marsh Creek Reservoir | 0 | 947 m | 3.97 km |
| 28 C0124 | Marsh Creek / Marsh Creek Reservoir / Marsh Creek Reservoir | 0 | 4.07 km | 4.07 km |
| 28 0412S | Marsh Creek / Shadow Lake / Marsh Creek Reservoir | 0 | 947 m | 4.05 km |
| 28 C0178 | Lafayette Creek / Lafayette Reservoir / Lafayette Reservoir | 55 m | 800 m | 800 m |
| 28 C0087 | San Ramon Creek / Eagle Lake / San Leandro Reservoir | 0 | 5.5 km | 11.64 km |
| 28 C0394 | San Ramon Creek / Eagle Lake / San Leandro Reservoir | 0 | 3.8 km | 11.42 km |
| 28 C0391 | San Ramon Creek / Eagle Lake / San Leandro Reservoir | 0 | 4.7 km | 11.66 km |
| 28 C0273 | Marsh Creek / Contra Loma Reservoir / Contra Loma Reservoir | 0 | 10.34 km | 10.34 km |
| 28 C0407 | Arroyo Del Hambre / Carquinez Strait / Mallard Reservoir | 0 | 1.16 km | 4.0 km |
| 28 C0144 | Marsh Creek / Marsh Creek Reservoir / Marsh Creek Reservoir | 0 | 3.91 km | 3.91 km |
| 28 C0145 | Marsh Creek / Marsh Creek Reservoir / Marsh Creek Reservoir | 0 | 1.8 km | 1.8 km |
| 28 C0264 | Arroyo Del Hambre / Carquinez Strait / Mallard Reservoir | 0 | 1.16 km | 4.5km |
| LF1* | Lafayette Creek / Lafayette Reservoir / Lafayette Reservoir | 0 | 812 m | 812 m |
Elevation Analysis Results
Elevation values for all facilities ranged from 1.15 to 281.23 m above sea level (Table 3). For suitable habitat facilities, elevations ranged from 1.15 to 281.23 m (mean = 58.31 ± 49.22 m). Potential use facilities occurred between 6.27 and 127.94 m (mean = 42.05 ± 36.36 m). Facilities surveyed ranged from 3.04 to 178.56 m (mean = 48.05 ± 44.09 m). Confirmed use facilities ranged from 5.24 to 172.97 m (mean = 85.45 ± 51.17 m).
Table 3. Facility elevation analysis. Values represent the range, mean, and variability (in m above sea level) by facility type, number in parenthesis represents the number of facilities per type.
| Facility Type | Minimum Elevation (m) | Mean Elevation (m) | Maximum Elevation (m) | Standard Deviation (m) | Elevation Range (m) |
| All Facilities (607) | 1.15 | 49.71 | 281.23 | 49.57 | 280.08 |
| Suitable Habitat Facilities (334) | 1.15 | 58.31 | 281.23 | 49.22 | 280.08 |
| Potential Use (22) | 6.27 | 42.05 | 127.94 | 36.36 | 121.70 |
| Facilities Surveyed (151) | 3.04 | 48.05 | 178.56 | 44.09 | 175.53 |
| Confirmed Use (12) | 5.24 | 85.45 | 172.97 | 51.17 | 167.74 |
Discussion
Facility Attributes and Structural Design
All confirmed use facilities possessed similar structural design elements, including reinforced concrete T-beam, I-beam, and box-girder configurations that created recessed, angular voids beneath the bridge deck. These underdeck spaces formed interconnected 90° intersections among girders, pile caps, and abutments that provided sheltered roosting conditions with reduced exposure to wind and light, consistent with structural attributes associated with bat use in previous studies (Keeley and Tuttle 1999; Erickson et al. 2003).
The confirmed use facilities ranged in age from 8 to 111 years old, indicating that bat use occurred across multiple eras of design. The majority of confirmed use facilities (8 of 12) were ≥50 years old and past their expected 50-year service life, including four constructed between 1950 and 1975 and four constructed in 1949 or earlier (Table 1). Older facilities often exhibited heavier concrete members, less standardized reinforcement, and rougher surface textures, conditions that likely increased surface irregularities and voids favorable for roosting (Erickson et al. 2003; Johnston et al. 2019).
Despite differences in construction era, confirmed use facilities in the Diablo East cluster, both constructed in 2018, structure ID 28 C0273 (replacement facility) and 28 C0411R (new facility), incorporated modern prestressed girder designs yet retained deep underdeck recesses, beam spacing, and void configurations comparable to older multi-span facilities that supported bat use. This suggests that roost suitability was more closely associated with structural form and void geometry than with facility age alone.
These observations indicate that structural form and void geometry may be more important to roost suitability than construction period. Further investigation of confirmed use facilities may improve understanding of how specific design elements may relate to different roost functions, including night roosts, day roosts, maternity roosts, or alternative roosts. Across these structural configurations, recessed T-beam, I-beam, and box-girder underdeck geometries with intersecting void spaces may support night roosting behavior, with secondary use as day roosts and more limited maternity roost potential in larger, thermally stable box-girder structures (Keeley and Tuttle 1999; Erickson et al. 2003). However, the assessment conducted surveys during daytime hours and could not definitively distinguish roost function; therefore, the assessment inferred these functional assignments from structural context and existing literature.
Two facilities located within the Diablo East cluster, structure IDs 28 C0145 (confirmed use) and 28 C0143 (potential use), were replaced following completion of field surveys, and the assessment did not conduct follow-up field surveys. Evaluation of the two replacement facilities with previous confirmed and potential use would further inform whether roost function persists following replacement with modern design specifications and whether changes in structural configuration influence continued bat occupancy.
Guano Use Levels
The assessment used guano staining and accumulation as a qualitative indicator of relative bat use intensity among confirmed use facilities, consistent with methods applied in previous studies (Keeley and Tuttle 1999; Adam and Hayes 2000; Pierson 1998; Erickson et al. 2003). Guano use levels included five low-use, six medium-use, and one high-use facility, indicating variation in observed use intensity among confirmed use facilities (Table 1). Differences in accumulation among confirmed use facilities may reflect variation in the number of individuals using individual facilities, frequency or duration of use, or roost function. Variation in guano accumulation among facilities within confirmed use clusters suggests that these facilities may function collectively as localized roost networks rather than as isolated roosts.
Multi-beam girder designs (Type 2) and T-beam designs (Type 4) account for most confirmed use facilities across the full range of guano categories, indicating that both designs can support bat use at varying observed use levels. In the structural classification framework described by Erickson et al. (2003), both Type 2 and Type 4 fall within the broader beam-girder bridge category, which is characterized by repeated longitudinal members and recessed underdeck spaces that create crevice habitat suitable for roosting. Structure ID 28 C0264 (Martinez), as previously described, did not fit the traditional NBI definition and had an open girder mixed-beam configuration that the standard NBI Type 19 classification does not represent well; the assessment therefore placed it within the beam-girder bridge category.
Overall, these patterns indicate that structural design alone did not explain differences in observed use intensity and that individual facility conditions and surrounding environmental context may also influence use.
Local Habitat Conditions and Landscape Context
Confirmed use facilities occurred in areas characterized by mixed forest, herbaceous vegetation, and persistent riparian corridors, including the mainstems and tributaries of Marsh Creek, Arroyo del Hambre, Lafayette Creek, and San Ramon Creek. Previous studies have shown that these types of landscape settings support bat foraging by providing linear travel corridors with elevated insect prey availability (Grindal et al. 1999; Lumsden and Bennett 2005; Fukui et al. 2006). Land cover analyses similarly indicated that potential use facilities occurred disproportionately within herbaceous and mixed forest cover within 500 m, whereas facilities with no confirmed or potential use occurred more frequently in intensively developed landscapes. This pattern suggests that surrounding land cover may influence whether bats use structurally suitable facilities.
The spatial alignment of confirmed and potential use facilities within mixed forest, herbaceous cover, and riparian corridors suggests that bat occupancy in Contra Costa County reflects the combined influence of facility structure and surrounding landscape context, rather than structural attributes alone, and is consistent with similar patterns in previous studies (Grindal et al. 1999; Adam and Hayes 2000; Lumsden and Bennett 2005; Fukui et al. 2006). These landscape attributes represent practical candidate inputs for development of a facility-specific habitat suitability layer for bat use.
Spatial Clustering and Roost Complex Connectivity
The assessment identified confirmed use facilities in four spatially clustered areas of Contra Costa County, including Diablo East, Martinez, Lafayette, and San Ramon, as identified in the Results. Nearest neighbor analysis confirmed that the distribution of confirmed use facilities formed a significant clustered spatial pattern, indicating that bat use was concentrated within localized areas rather than a random dispersal pattern across the county. Within these areas, confirmed use of facilities occurred in proximity to settings characterized by high facility density and linear riparian networks.
This spatial pattern is consistent with documented bat commuting behavior in riparian environments, where movement occurs along linear corridors connecting roosting and foraging areas (Fukui et al. 2006). The presence of multiple confirmed use facilities within localized areas is also consistent with roost switching behavior, in which bats use several proximate roosts to balance thermoregulation, disturbance, predator avoidance, and access to foraging habitat (Keeley and Tuttle 1999). These spatial characteristics represent candidate inputs for facility-specific habitat suitability layers, together with the structural attributes and local habitat conditions described previously.
Elevation and Topographic Setting
Facilities evaluated in this assessment ranged from 1 to 281 m above sea level. Confirmed use facilities occurred more frequently in higher elevation foothill and valley transition zones than in the lowest valley-floor settings. This pattern suggests that elevation may reflect a broader landscape context where elevation acts as a covariate of riparian corridors and suitable vegetation structure, rather than acting as an independent factor to inform bat use, consistent with previous findings (Keeley and Tuttle 1999; Adam and Hayes 2000; Starbuck et al. 2020).
Riparian Connectivity and Proximity to Water
Of the 12 confirmed use facilities, 11 occurred at 0 m from a creek water feature, and all 12 occurred within 55 m of a creek water feature. This spatial pattern is consistent with previous studies documenting associations between bat activity and riparian systems in both natural and modified landscapes (Lumsden and Bennett 2005; Fukui et al. 2006; Hein et al. 2009). The close spatial association with linear riparian corridors suggests that proximity to hydrologic features may be an important characteristic associated with facility use. Proximity to perennial water bodies such as municipal lakes and reservoirs also supports localized foraging activity by providing persistent aquatic habitat in Mediterranean climate systems where seasonal streams experience reduced summer flow. The proximity of water features may therefore represent a practical candidate input for development of a facility-specific habitat suitability layer and warrants further investigation.
Soil and Landform Associations
Facilities with confirmed and potential use occurred most frequently within landscapes dominated by Mollisols and Vertisols. Mollisols comprised 36.73% of soils associated with confirmed use facilities and 39.02% of soils associated with potential use facilities, while Vertisols comprised 33.67% and 32.52%, respectively. Both soil orders commonly occur in alluvial valleys and floodplains that often coincide with riparian corridors (Grindal et al. 1999; Fukui et al. 2006). Compared with the countywide baseline, confirmed and potential use facilities showed greater representation of Mollisols and Vertisols relative to other soil orders. Given that many facilities evaluated in this assessment, including bridges and culverts, crossed creeks and valley bottoms, observed soil associations likely reflect underlying landform and hydrologic settings rather than independent predictors of bat use.
Transportation Noise Level Analysis
Confirmed bat use occurred across the lowest, intermediate, and highest modeled transportation decibel ranges represented in the USDOT 2020 dataset. The USDOT noise dataset is a national-scale, model-derived continuous LAeq,24h (dB) surface that provides a planning-level measure of transportation noise conditions. The USDOT 2020 dataset uses the same general LAeq-based metric used by the California Department of Transportation (Caltrans) for transportation noise assessment, although Caltrans applications can use project-level Traffic Noise Model outputs with finer spatial resolution and receptor-specific inputs. The USDOT 2020 dataset provides a consistent measure of relative transportation noise conditions across the study area but does not represent biologically calibrated exposure or bat-specific auditory sensitivity. The assessment used the nationally consistent dataset because comparable region-wide modeled noise surfaces were not available for the entire study area.
Future research and transportation planning would benefit from approaches such as Schaub et al. (2008), Siemers and Schaub (2011), and Fensome and Mathews (2016), which quantify traffic noise using sound pressure level (SPL) measurements from field recordings or controlled playback experiments. These SPL-based methods directly evaluate bat behavioral responses under defined acoustic conditions and differ fundamentally from the modeled A-weighted LAeq surfaces previously described. Incorporating site-specific acoustic measurements and frequency-weighted metrics aligned with bat hearing ranges would improve inference about biologically relevant acoustic exposure and strengthen future habitat suitability models.
Spatial Scale Interpretation
The assessment used the 100-m and 500-m buffers described in the Methods to evaluate bat use at two spatial scales. The 100-m buffer represented the immediate area surrounding each facility and supported evaluation of suitable habitat based on the suitable habitat layer. The 500-m buffer represented the broader area surrounding each facility and captured secondary and alternative roost facilities, CNDDB occurrences, land cover, and neighboring facilities within localized roost networks. Evaluating both spatial scales allowed the assessment to examine relationships between bat use and habitat characteristics immediately surrounding facilities as well as conditions within the broader localized roost network (Hilty and Merenlender 2004; Starbuck et al. 2020). At the facility and 100-m scales, bat use showed associations with immediate environmental conditions, including vegetation structure and proximity to hydrologic features. At the 500-m scale, a scale consistent with reported movement distances for bat species that use riparian habitats, bat use showed stronger associations with facility arrangement, riparian connectivity, and clustering along connected creek corridors (Hilty and Merenlender 2004; Starbuck et al. 2020).
Design and Management Considerations
Facility owners should incorporate recessed underdeck areas, increased void spaces, and soffit conditions that provide suitable bat roosting habitat when designing facility retrofits, repairs, and replacements in locations with suitable bat habitat. These design elements can reduce potentially significant impacts to bats and help offset habitat loss associated with simplified designs resulting from uniform methods like ABC. Multi-beam girder designs (Type 2) and T-beam designs (Type 4) occurred among facilities with confirmed or potential bat use and may warrant consideration when evaluating facilities for current bat occupancy and developing replacement designs that retain or incorporate structural features that could provide bat roosting habitat. Previous assessments of transportation facilities have also documented relationships between transportation design elements and bat use, including evaluations of structure type and structural features associated with bat roosting (Keeley and Tuttle 1999; Johnston et al. 2019).
Facility owners may also consider accessory measures, such as mounted bat boxes, integrated roost panels, standalone roost structures, or roost installations on adjacent transportation facilities, nearby structures, or trees, when incorporating roost elements into the primary design is not feasible (Johnston et al. 2019). Early coordination among engineers, planners, biologists, and resource agencies can help engineers and planners incorporate these considerations into facility design and delivery.
Conservation planning for bats and their habitat provides important context for bat conservation and habitat protection. Assessing county transportation facilities and suitable habitat can help identify and document bat resources, particularly within clustered roost distributions and riparian corridors across Contra Costa County, including the Diablo East, Martinez, Lafayette, and San Ramon clusters. Although individual facilities remain the primary unit of assessment for standalone projects, confirmed bat use occurred within localized groups of facilities, indicating that facility owners should consider nearby structures when planning bat assessments and project activities. The 500-m spatial analysis also identified relationships among neighboring facilities and other landscape characteristics within localized roost networks, supporting consideration of the broader spatial context when evaluating facilities for bat use.
Facility owners that initiate projects at multiple facilities within the same riparian corridor should employ phased construction over multiple seasons where surveys have confirmed bat use. Facility owners should also schedule projects to avoid activities during sensitive periods of bat activity, such as the reproductive season.
The assessment identified a strong association between confirmed bat use and nearby water features. Facility owners should consider proximity to water features when evaluating facilities for current bat occupancy during facility repair, retrofit, and replacement. The assessment also recommends continued evaluation of roost networks and riparian corridors in Contra Costa County. Continued evaluation of roost networks and riparian corridors in Contra Costa County could further improve understanding of spatial patterns of bat use, particularly along Marsh Creek, Deer Creek, San Ramon Creek, Arroyo del Hambre, and Lafayette Creek and their tributaries. The assessment did not identify all roost networks and stream corridors that support bats within Contra Costa County, and additional locations supporting bat use are likely.
Cliff Swallow Nest Management Considerations
Cliff Swallow nests represent an additional consideration for bat impact avoidance during facility maintenance, retrofit, and replacement. Previous studies have documented Brazilian free-tailed bats, a species known to occur in Contra Costa County, using unoccupied Cliff Swallow nests as opportunistic roosts on bridges and culverts (Buchanan 1958; Ritzi et al. 1998). Activities involving nest removal or exclusion often follow construction schedules designed to comply with the Migratory Bird Treaty Act and seasonal avoidance and minimization measures for bird species but may inadvertently affect bats if conducted without consideration of bat seasonality. Caltrans guidance (Johnston et al. 2019) recommends pre-removal surveys, appropriate timing, and coordination with wildlife agencies where Cliff Swallow nests occur on facilities to avoid potentially significant impacts to bats. Facility owners should evaluate unoccupied Cliff Swallow nests for potential bat use before nest removal or facility modifications, particularly where surveys identify other structural conditions conducive to bat roosting.
Uncertainty, Future Research, and Predictive Tools
Several uncertainties limit interpretation of the bat use patterns documented by this assessment. Diurnal surveys and guano use level assessments provide indicators of bat presence but do not resolve species identity, colony size, or seasonal variation in use, and observed guano staining may reflect intermittent or transient occupancy rather than sustained roosting. This assessment did not include seasonal replication, prey availability, thermal microclimate measurements, or hydrologic seasonality, all of which may influence bat use of facilities within riparian corridors (Fukui et al. 2006; Duchamp and Swihart 2008; Hein et al. 2009).
The assessment evaluated modeled transportation noise as a planning-level measure of relative noise conditions at facilities; however, the relationship between noise exposure and long-term persistence of bat use requires site-specific transportation noise measurements for evaluation, and the modeled noise data do not characterize bat auditory perception or sensitivity.
Acoustic monitoring at confirmed and potential use facilities could improve species-level identification and characterization of activity patterns.
Incorporation of microclimate measurements beneath facility decks may also clarify how structural configuration, shading, and materials influence roost conditions. Monitoring the recently replaced facilities, structure ID 28 C0143 and 28 C0145, both in the Diablo East cluster, may determine whether bat use persists after replacement and further inform the importance of incorporating structural design elements conducive to bat use into the design process. Broader investigation across riparian corridors, including Marsh Creek, Deer Creek, Lafayette Creek, San Ramon Creek, and Arroyo del Hambre, may further inform understanding of corridor-scale movement, roost switching, and seasonal use patterns of bats in Contra Costa County.
Finally, existing landscape-scale habitat suitability datasets do not explicitly represent the structural and environmental elements that this assessment identified. Results from this inventory may therefore further inform the development of habitat suitability datasets specific to bat use of transportation facilities. Future facility-specific suitability datasets could incorporate these structural and landscape characteristics as candidate inputs for identifying facilities and areas that may warrant further assessment. The suitable habitat layer and suitable habitat facility determination process successfully identified all 12 confirmed use facilities and all 22 potential bat use facilities for field surveys, demonstrating their utility as screening tools. Future predictive tools should support, rather than replace, field surveys used to confirm bat use.
Acknowledgments
The author of this inventory would like to acknowledge support from the Contra Costa County Fish and Game Committee, environmental program management at the California Department of Fish and Wildlife, Bay Delta Region, and support from scientists around the state of California. This study should not be utilized to determine bat presence or absence at specific project locations.
Literature Cited
- Adam, M. D., and J. P. Hayes. 2000. Use of bridges as night roosts by bats in the Oregon Coast Range. Journal of Mammalogy 81(2):402–407.
- American Society of Civil Engineers (ASCE). 2017. 2017 Infrastructure Report Card: Bridges. American Society of Civil Engineers, Reston, VA, USA.
- Buchanan, G. D. 1958. Tadarida and Myotis occupying cliff swallow nests. Journal of Mammalogy 39(3):434.
- California Department of Fish and Wildlife (CDFW). 2025a. Biogeographic Information and Observation System (BIOS) public data layers. California Department of Fish and Wildlife, Sacramento, CA, USA.
- California Department of Fish and Wildlife (CDFW). 2025b. California Natural Diversity Database: Predicted habitat datasets. California Department of Fish and Wildlife, Sacramento, CA, USA.
- Culmo, M. P., J. R. Marsh, and J. S. O’Connor. 2011. Accelerated Bridge Construction: Experience in Design, Fabrication, and Erection of Prefabricated Bridge Elements and Systems. Federal Highway Administration, Washington, D.C., USA.
- Dewitz, J. 2023. National Land Cover Database (NLCD), 2021 products. U.S. Geological Survey data release. Available from: https://www.usgs.gov/centers/eros/science/national-land-cover-database
- Duchamp, J. E., and R. K. Swihart. 2008. Shifts in bat community structure related to evolved land use in central Indiana. Journal of Wildlife Management 72(2):493–500.
- East Bay Regional Park District (EBRPD). 2018. Bat Distribution and Abundance in the East Bay Regional Park District. East Bay Regional Park District, Oakland, CA, USA.
- Erickson, G. A., E. D. Pierson, and W. E. Rainey. 2003. Bats and Bridges: Identifying Roosting Habitat. Federal Highway Administration, Washington, D.C., USA.
- Federal Highway Administration (FHWA). 2022–2025. National Bridge Inventory (NBI) dataset. Federal Highway Administration, Washington, D.C., USA.
- Fensome, A. G., and Mathews, F. 2016. Roads and bats: a meta-analysis and review of the evidence on vehicle traffic and bat populations. Mammal Review 46(4):267–279.
- Fukui, D., M. Murakami, S. Nakano, and T. Aoi. 2006. Effect of emergent aquatic insects on bat foraging in a riparian forest. Journal of Animal Ecology 75(6):1252–1258.
- Grindal, S. D., J. L. Morissette, and R. M. Brigham. 1999. Concentration of bat activity in riparian habitats over an elevation gradient. Canadian Journal of Zoology 77:972–977.
- Hein, C. D., S. B. Castleberry, and K. V. Miller. 2009. Site occupancy of bats in relation to forested corridors. Forest Ecology and Management 257:1200–1207.
- Hilty, J. A., and A. M. Merenlender. 2004. Use of riparian corridors and vineyards by mammalian predators in northern California. Conservation Biology 18(1):126–135.
- Johnston, D. S., K. Briones, and C. Pincetich. 2019. California Bat Mitigation: a guide to developing feasible and effective solutions. Prepared by H. T. Harvey & Associates for the California Department of Transportation, Sacramento, CA, USA.
- Keeley, B. W., and M. D. Tuttle. 1999. Bats in American Bridges. Bat Conservation International, Austin, TX, USA.
- Kunz, T. H., and S. Parsons, editors. 2009. Ecological and Behavioral Methods for the Study of Bats. 2nd edition. Johns Hopkins University Press, Baltimore, MD, USA.
- San Francisco Estuary Institute (SFEI). 2017. California Aquatic Resource Inventory (CARI), Version 2. San Francisco Estuary Institute, Richmond, CA, USA.
- Schaub, A., J. Ostwald, and B. M. Siemers. 2008. Foraging bats avoid noise. Journal of Experimental Biology 211:3174–3180.
- Siemers, B. M., and A. Schaub. 2011. Hunting at the highway: traffic noise reduces foraging efficiency in acoustic predators. Proceedings of the Royal Society B: Biological Sciences 278(1712): 1646–1652.
- Starbuck, C. A., L. K. Amelon, and D. J. Thompson. 2020. Scale-dependent responses of bats to landscape structure in a forest–agriculture mosaic. Landscape Ecology 35:115–129.
- U.S. Department of Transportation (USDOT). 2020. National Transportation Noise Map. U.S. Department of Transportation, Washington, D.C., USA.
- U.S. Fish and Wildlife Service and Illinois Department of Transportation (USFWS/IDOT). 2010. Bridge/Structure Bat Assessment Form. U.S. Fish and Wildlife Service and Illinois Department of Transportation.
- U.S. Geological Survey (USGS). 2023. gSSURGO database for the United States. U.S. Geological Survey data release. Available from: https://www.nrcs.usda.gov/resources/data-and-reports/gridded-soil-survey-geographic-gssurgo-database
- U.S. Geological Survey (USGS). 2024. 3D Elevation Program (3DEP) digital elevation model, 1/3 arc-second. U.S. Geological Survey data release. Available from: https://www.usgs.gov/3d-elevation-program